Bitcoin Forecast: Potential Price Reversal Ahead!
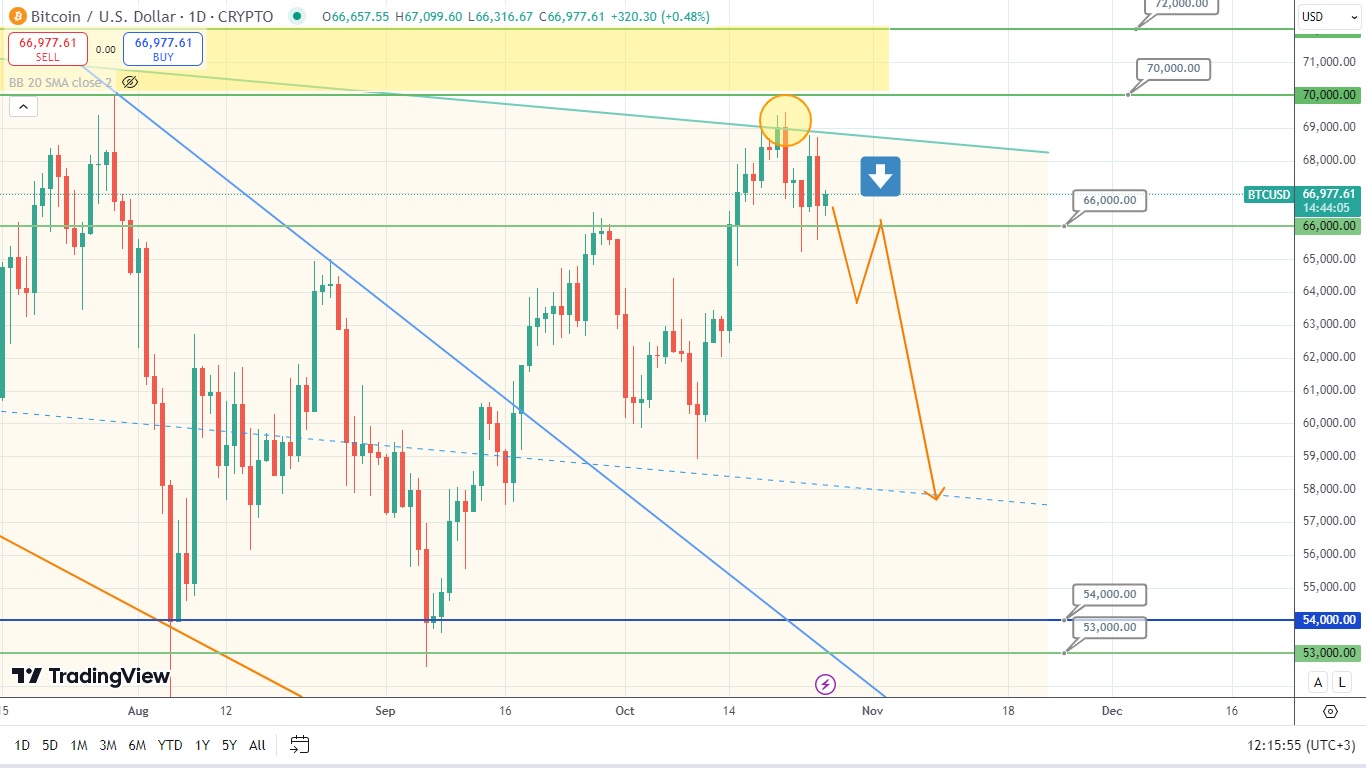
The price of Bitcoin rebounded to the flat boundary of the downtrend and pulled back. Currently, the price of this asset is testing the resistance level of 66000. Once the resistance is broken, the price of Bitcoin might potentially drop to the level of 60000. So, let’s wait and see how soon this scenario is going to work out.

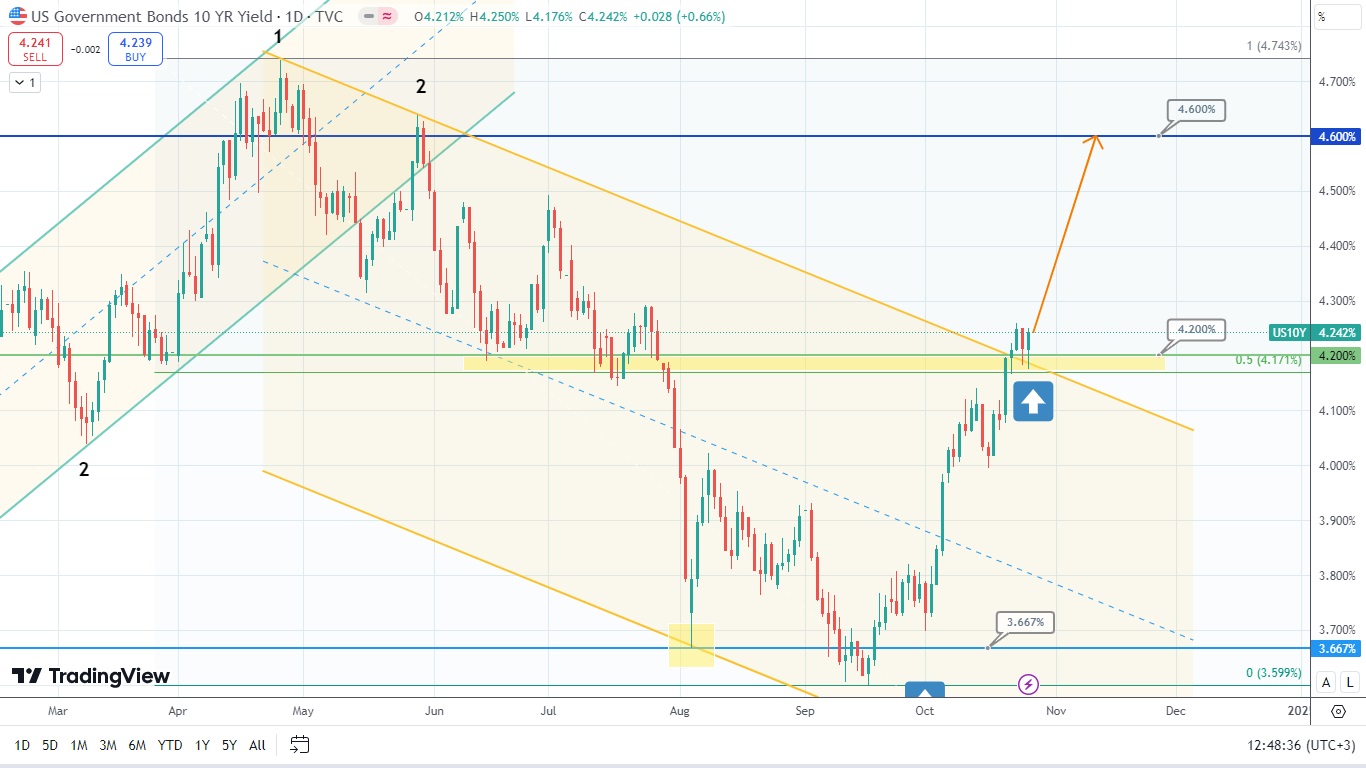
The price of U.S. 10 Year Treasury broke the upper boundary of the downtrend. Now, it is actively testing the broken side. The price of this asset was consolidating on the broken trend for several days in a row. Also, this trend is located right next to the broken horizontal level of 4.30%, which almost coincides with the 50% Fibonacci retracement level expanded along the latest descending move. It means that the yield of this asset should rise at the beginning of the next trading week. It might eventually hit the level of 4.6%. Don’t forget that when the bond’s price falls, its yield increases and vice versa. So, let’s wait and see what will happen next.
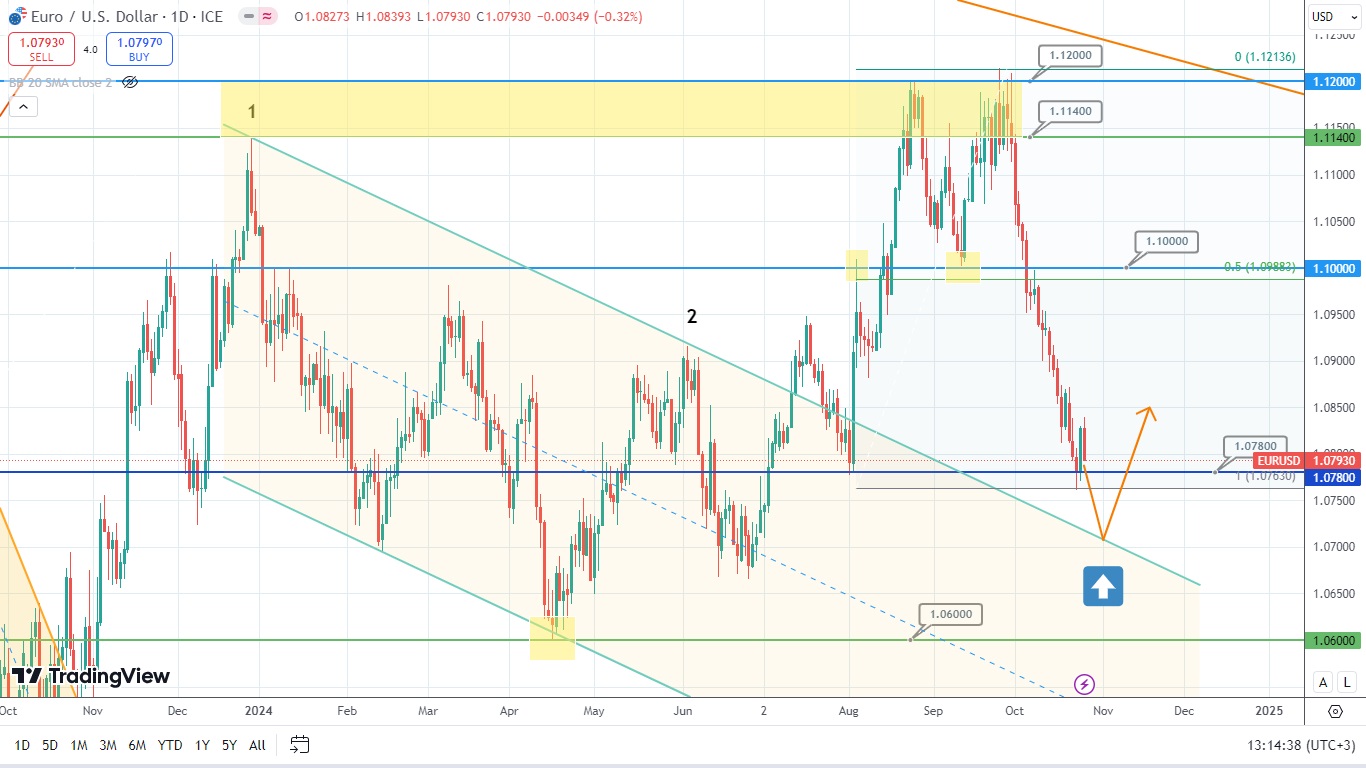
The price of the currency pair EUR/USD is heading down, targeting the broken downtrend. The price of this asset is likely to rebound from the broken downtrend and rise. Of course, this price rise might even begin on Monday, however it is unlikely to happen. First, the price of this currency pair might dive below the level of 1.0780 and then only undergo the long-awaited correction, and rise. Time will tell when it is going to happen.
Disclaimer: The material provided is for information purposes only and should not be considered as investment advice. The views, information, or opinions expressed in the text belong solely to the author, and not to the author’s employer, organization, committee or other group or individual or company.
Past performance is not indicative of future results.
High Risk Warning: CFDs are complex instruments and come with a high risk of losing money rapidly due to leverage. 69% and 73% of retail investor accounts lose money when trading CFDs with Tickmill UK Ltd and Tickmill Europe Ltd respectively. You should consider whether you understand how CFDs work and whether you can afford to take the high risk of losing your money.
Futures and Options: Trading futures and options on margin carries a high degree of risk and may result in losses exceeding your initial investment. These products are not suitable for all investors. Ensure you fully understand the risks and take appropriate care to manage your risk.