Chart of The Day USD Index
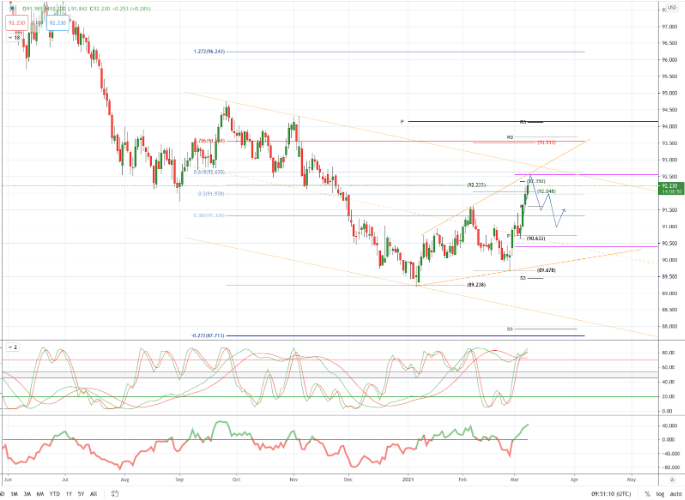
Chart of The Day USD Index
USD Index Probable Price Path & Potential Reversal Zone
The U.S. employment data was better than expected, and the U.S. Treasury bill yield rate rose. Among them, the 10-year Treasury bill yield rate rose by nearly 6 basis points to 1.624% last Friday, setting a new high for more than a year. The rise in yields drove the exchange rate of the U.S. dollar. The U.S. dollar index closed up 0.4% to 92, a three-month high. The weekly increase of 1.2% was also the largest since the end of October last year.
U.S. employment data improves. The number of non-agricultural jobs increased by 379,000 in February, which was higher than the 200,000 expected by the market. The increase in non-agricultural employment in January was revised upward from 49,000 to 166,000. The unemployment rate fell from 6.3% to 6.2%, the lowest since the outbreak of the epidemic in March last year. The market will pay attention to the inflation data released this week, including the February consumer price index released on Wednesday
The Senate passed 50 votes in favor to 49 against, and passed the $1.9 trillion rescue plan. American nationals with an annual income of less than US$80,000 will receive a maximum of US$1,400 in cash. The income ceiling is lower than the plan passed by the House of Representatives. The plan also includes US$160 billion for vaccines and testing, and US$360 billion for assistance to state and local governments, but the proposal to raise the federal minimum hourly wage to $15 was rejected. The House of Representatives is expected to vote on the amendment on Tuesday

From a technical and trading perspective, Bearish USD sentiment was pared back again this week, reversing the minor increase in the prior week. The aggregated short USD position reflected in the currencies we monitor in this report was reduced by USD1.3bn to a little over USD29.1bn, still significant but the lowest bear bet on the USD since the start of December. This position reduction could allow for some fresh supply to enter the market at current levels.
Technically the USD Index is testing a pivotal resistance cluster, 92.23 represents and symmetry swing versus the last corrective in September of 2020, 92.63 in the 61.8% Fibonacci retracement of the late 2020 decline, while 92.53 represents projected monthly range resistance and ascending trendline resistance. Watch for bearish reversal patterns to develop in this zone as an opportunity to deploy short exposure initially targeting 91.50 and 91.00 in a three wave pattern, through here can open a test of monthly projected range support below 90.50. A closing breach of 93.00 on the upside would open further upside extension to test the pivotal 94.70 level.
Disclaimer: The material provided is for information purposes only and should not be considered as investment advice. The views, information, or opinions expressed in the text belong solely to the author, and not to the author’s employer, organization, committee or other group or individual or company.
High Risk Warning: CFDs are complex instruments and come with a high risk of losing money rapidly due to leverage. 75% and 65% of retail investor accounts lose money when trading CFDs with Tickmill UK Ltd and Tickmill Europe Ltd respectively. You should consider whether you understand how CFDs work and whether you can afford to take the high risk of losing your money
Disclaimer: The material provided is for information purposes only and should not be considered as investment advice. The views, information, or opinions expressed in the text belong solely to the author, and not to the author’s employer, organization, committee or other group or individual or company.
Past performance is not indicative of future results.
High Risk Warning: CFDs are complex instruments and come with a high risk of losing money rapidly due to leverage. 69% and 73% of retail investor accounts lose money when trading CFDs with Tickmill UK Ltd and Tickmill Europe Ltd respectively. You should consider whether you understand how CFDs work and whether you can afford to take the high risk of losing your money.
Futures and Options: Trading futures and options on margin carries a high degree of risk and may result in losses exceeding your initial investment. These products are not suitable for all investors. Ensure you fully understand the risks and take appropriate care to manage your risk.
Patrick has been involved in the financial markets for well over a decade as a self-educated professional trader and money manager. Flitting between the roles of market commentator, analyst and mentor, Patrick has improved the technical skills and psychological stance of literally hundreds of traders – coaching them to become savvy market operators!