Chart of The Day USDollar Index
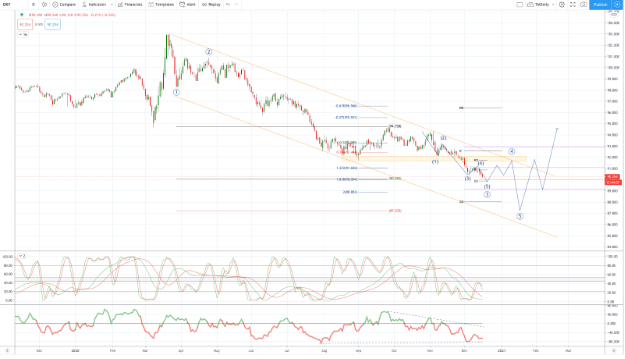
Chart of The Day USDollar Index
USDollar Index Probable Price Path & Potential Reversal Zone
US stock finished higher overnight, supported by stimulus optimism. The Dow rose 1.1%; the S&P500 and NASDAQ both gained 1.3%, reflecting broad-based gains across all sectors. This comes as markets are betting on lawmakers to approve a combined bipartisan deal worth $908b ahead of Christmas and before the year ends. The deal is now separated into two separate bills - $748b for funding that garners the most widespread support and another $160b for more divisive/hard to resolve issues. Meanwhile, vaccine rollout remains underway in the US where daily new cases remain at above 100k. Treasury yields rose alongside higher stocks. Overall yields went up by 0.3 to 2.1bps across the curve; 10Y UST yield gained 1.5bps to 0.908%.
Gold futures rebounded by 1.3% to $1852.3/oz as the dollar weakened further. GBP continued to rally by more than 1%, propelled by bullish Brexit sentiment. A Brexit deal seems more possible as the 1 Jan deadline approaches; markets are pining for a trade deal to be hammered out to prevent a disastrous fallout comes 1 Jan that could see the end of free flows of goods, services and people between the UK and the continent. Oil benchmarks surged on stimulus hope. Brent crude gained 0.9% to $50.76/barrel while WTI rallied by 1.3% to settle at $47.62/barrel.
US industrial production rose in November, but still below pre-pandemic level:Industrial production rose 0.4% MOM in November, following the downwardly revised 0.9% growth in October, supported by both manufacturing and mining production. Manufacturing rose for the seventh consecutive month by 0.8% MOM, attributed to the robust 5.3% growth in vehicles and parts. Utilities (-4.3%) declined as warmer than usual temperature reduced demand for heating. The industrial production index has now recovered to about 5% below its pre-pandemic level (Feb), after having fallen 16.5% from Feb- April. The New York Fed Empire State Manufacturing Index slipped to 4.9 in December (Nov: 6.3), reflecting weaker new orders. This is in line with overall weaker trend observed in other regional manufacturing gauges. General business outlook for next six months however improved.

From a technical and trading perspective, the USDollar Index has reached the target zone discussed in our Weekly Market Outlook and Weekly Live Analysis sessions just ahead of the 90.00 level, on the weekly chart above you can see we are testing an internal trendline. On the daily timeframe below you can see that price has potential completed an interim 5 wave cycle just above the weekly S3. Price could correct from current levels in a three wave pattern to test the pivot 92.00 level from below, however, as this area caps the corrective advance it is possible that price extends lower to challenge the primary equality objective at 87.20/40 from here we can reasonably expect to see a more meaningful correction develop especially as we head into the beginning of next year with January normally proving to be a seasonally strong period the USD. The USD price pattern has significant implications with USDXXX majors specifically watch for pullbacks in the EURUSD from 1.23, AUDUSD from .77 and NZDUSD from .7200

Disclaimer: The material provided is for information purposes only and should not be considered as investment advice. The views, information, or opinions expressed in the text belong solely to the author, and not to the author’s employer, organization, committee or other group or individual or company.
High Risk Warning: CFDs are complex instruments and come with a high risk of losing money rapidly due to leverage. 72% and 75% of retail investor accounts lose money when trading CFDs with Tickmill UK Ltd and Tickmill Europe Ltd respectively. You should consider whether you understand how CFDs work and whether you can afford to take the high risk of losing your money.
Disclaimer: The material provided is for information purposes only and should not be considered as investment advice. The views, information, or opinions expressed in the text belong solely to the author, and not to the author’s employer, organization, committee or other group or individual or company.
Past performance is not indicative of future results.
High Risk Warning: CFDs are complex instruments and come with a high risk of losing money rapidly due to leverage. 69% and 73% of retail investor accounts lose money when trading CFDs with Tickmill UK Ltd and Tickmill Europe Ltd respectively. You should consider whether you understand how CFDs work and whether you can afford to take the high risk of losing your money.
Futures and Options: Trading futures and options on margin carries a high degree of risk and may result in losses exceeding your initial investment. These products are not suitable for all investors. Ensure you fully understand the risks and take appropriate care to manage your risk.
Patrick has been involved in the financial markets for well over a decade as a self-educated professional trader and money manager. Flitting between the roles of market commentator, analyst and mentor, Patrick has improved the technical skills and psychological stance of literally hundreds of traders – coaching them to become savvy market operators!