Daily Market Outlook, February 28, 2020
Daily Market Outlook, February 28, 2020
Deepening virus fear led the US market to sell off for yet another day. The Dow Jones Industrial Average posted its largest single-day point drop in history (-1191pts or -4.4%), slumped into correction territory alongside the S&P500 (-4.4%) while tech-heavy NASDAQ tumbled 4.6%.
The CDC confirmed the first US Covid-19 case with no travelling history, raising the risk of a community spread. The outbreak has begun to take the form of a global pandemic with around 3500 cases and 54 deaths confirmed across 44 countries according to Reuters. Treasury yields plummeted by 7-10bps along the curve where benchmark 10UST yield was seen plunging to an all-time low of 1.26%. CHF and JPY strengthened tremendously while gold price continued to climb 0.3% to seven-year high. Crude oils collapsed by more than 3%.
US 4Q GDP growth unrevised: US 4Q GDP growth was unrevised at an annualised rate of 2.1% QOQ according to the BEA’s second estimate (3Q: +2.1%). The print matched consensus estimate and was similar to 3Q’s reading, putting the US economy in a solid state. However, growth in private consumption expenditure (PCE), a gauge of consumer spending which made up about two third of the US economy was revised down from 1.8% to 1.7%. For the full year of 2019, US real GDP growth moderated to 2.3% compared to 2.9% recorded in 2018, reflecting slower gain in nonresidential fixed investment and PCE, which were partly offset by accelerations in government spending and smaller rise in imports. On a separate note, initial jobless claims rose by 8k to 219k last week (previous: 211k revised); the 4-week average stood at 209.75k (previous: 209.25k).
Durable goods orders little changed in Jan as civilian aircrafts jumped: Durable goods orders slipped a mere 0.2% MOM in January (Dec: +2.9% revised) following an upwardly revised growth. The solid headline reading beat consensus estimate of a 1.4% drop, mainly reflecting the nearly 350% jump in the volatile civilian aircrafts category. Excluding transportation, orders rose 0.9% MOM (Dec: +0.1%). Notably, orders of the nondefense capital goods excluding aircrafts, a key gauge of business spending saw a surprise pick-up of 1.1% MOM (Dec: -0.5%). Shipment of such goods (part of GDP calculation) also gained 1.1% MOM (Dec: -0.1%), offering tentative signs that investment is rebounding in 1Q. On a separate note, the Kansas City Fed Manufacturing Index beat expectation at 5.0 in February (Jan: -1), in line with the rebound/higher readings of other regional manufacturing gauges.
Pending home sales point to existing home sales rebound: US pending home sales rebounded to increase 5.2% MOM in January (Dec: -4.3% revised), beating consensus estimate of a 3.0% growth. The index measured the number of contracts signed to buy existing single-family homes, pointing to a rebound in existing home sales in February.
Better economic sentiment in Eurozone: The European Commission Economic Sentiment Indicator rose slightly to 103.5 in February (Jan: 102.6), boosted by the 1.5pts rise in consumer confidence (-6.6 vs -8.1) and partly by industrial confidence. EC said that household’s expectations of general economic situation turned “much brighter '' this month, but we caution that sentiment could take a u-turn soon in response to the rapid spread of Covid19 especially in Italy and Germany that is putting the borderless bloc at risk.
Weak Japan data: Japan jobless rate surprisingly rose to three-month high of 2.4% in January (Dec: 2.2%) back to October’s level during which the country’s economic activity was severely disrupted by an early-month typhoon, reflecting weakness in the job market prior to Covid-19 outbreak. The job-to-applicant ratio dropped significantly to 1.49 (Dec: 1.57) as authority’s new reporting standards (employers to provide more info) may have discouraged job listing. Total job offers slipped 3.9% MOM of which new job offers was seen declining by nearly 16%. The weaker job data were concurrent with the continuously weak industrial production number that has barely recovered (+0.8% MOM vs +1.2% MOM) from the downturn in OctNov. YOY, industrial production nonetheless fell by a smaller margin of 2.5% (Dec: -3.1%). On a brighter note, retail sales managed to pick up a modest 0.6% MOM (Dec: +0.2%) that left the YOY contraction much smaller at -0.4% (Dec: -2.6%).
Improved UK consumer confidence: The GfK Consumer Confidence Index picked up 2pts to -7 in February (Jan: -9), its best reading in more than 1.5 years, again reflecting consumer’s improved expectation of economic outlook in the absence of Brexit uncertainties after the country formally withdrew from the EU in late January.
Citi Preliminary Month End Rebalancing view: The month-end FX hedge rebalancing model sends a stronger than average signal for USD buying today.· Global equity markets have performed unusually badly this week with the MSCI US index losing -12.1% from its 19 February high. The six-day loss in the index is the worst since August 2011. This has turned US equities from among the best performers to the worst and flipped the rebalancing signal from net USD selling in the preliminary estimate to USD buying.· The USD buy-signal is stronger than the historical average, measuring 1.4 standard deviations across all G10 crosses. We estimate this to be equivalent to about 13bp of all passive hedged index-following assets globally. The signal is entirely driven by foreigners’ needs to reduce hedges on US equities. Fixed income hedge rebalancing needs are estimated to be marginally USD negative. · The signal to sell JPY vs USD is weaker than average due to assumed lower hedge ratios employed by Japanese investors. This dampens the domestic needs to sell JPY to reduce hedges on foreign assets.
Today’s Options Expiries for 10AM New York Cut (notable size in bold)
- EURUSD: 1.0850 (EUR784mn); 1.0875 (EUR503mn); 1.0900 (EUR2.3bn); 1.0920 (EUR468mn); 1.0935 (EUR520mn); 1.0950 (EUR1.9bn); 1.0980 (EUR658mn); 1.1000 (EUR752mn); 1.1055 (EUR774mn); 1.1060 (EUR415mn); 1.1100 (EUR989mn)
- GBPUSD: 1.2939 (GBP386mn)
- USDJPY: 108.70 (USD738mn); 109.25 (USD540mn); 109.50 (USD355mn); 109.75 (USD400mn); 110.00 (USD603mn); 110.50 (USD442mn); 110.65 (USD430mn); 110.75 (USD700mn)
- 0.6600 (AUD711mn); 0.6640 (AUD372mn); 0.6655 (AUD421mn)
Technical & Trade Views
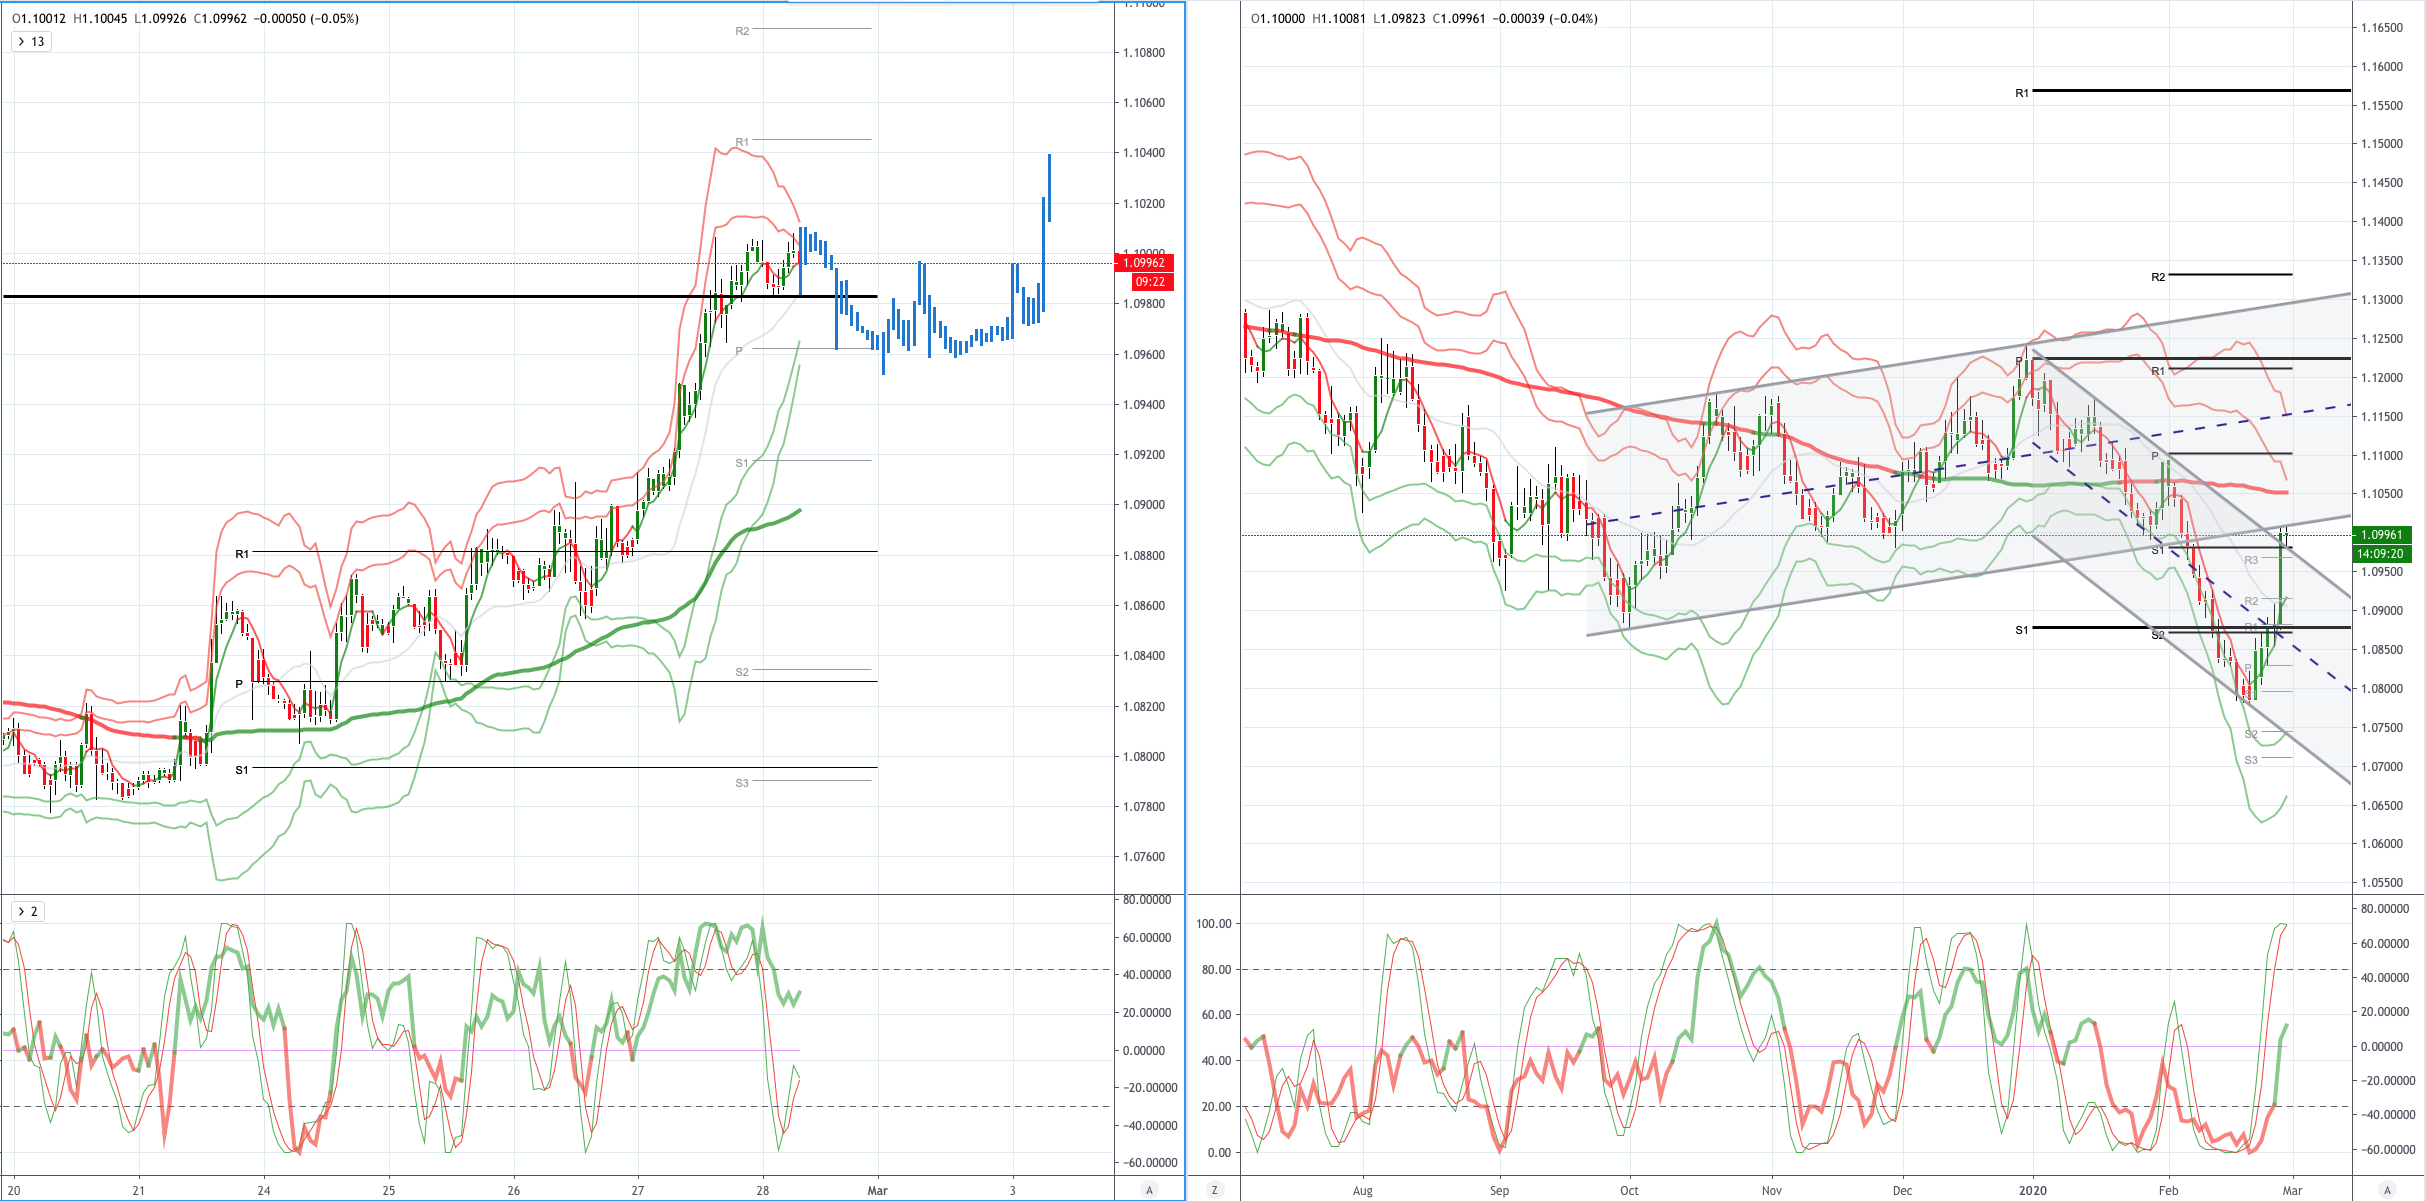
EURUSD (Intraday bias: Bullish above 1.0960 bearish below)
EURUSD From a technical and trading perspective, Optionality drew prices higher yesterday, however, we are now testing pivotal 1.0920/30 resistance, look for some selling pressure to emerge here, ahead of the descending trendline resistance sighted at 1.0950, if nascent bulls can defend 1.0880 then we may see further short covering into month end UPDATE as 1.0950 contains corrections bulls look for a test of 1.1050. On the day only a close below 1.09 would suggest a false upside break and return to trend
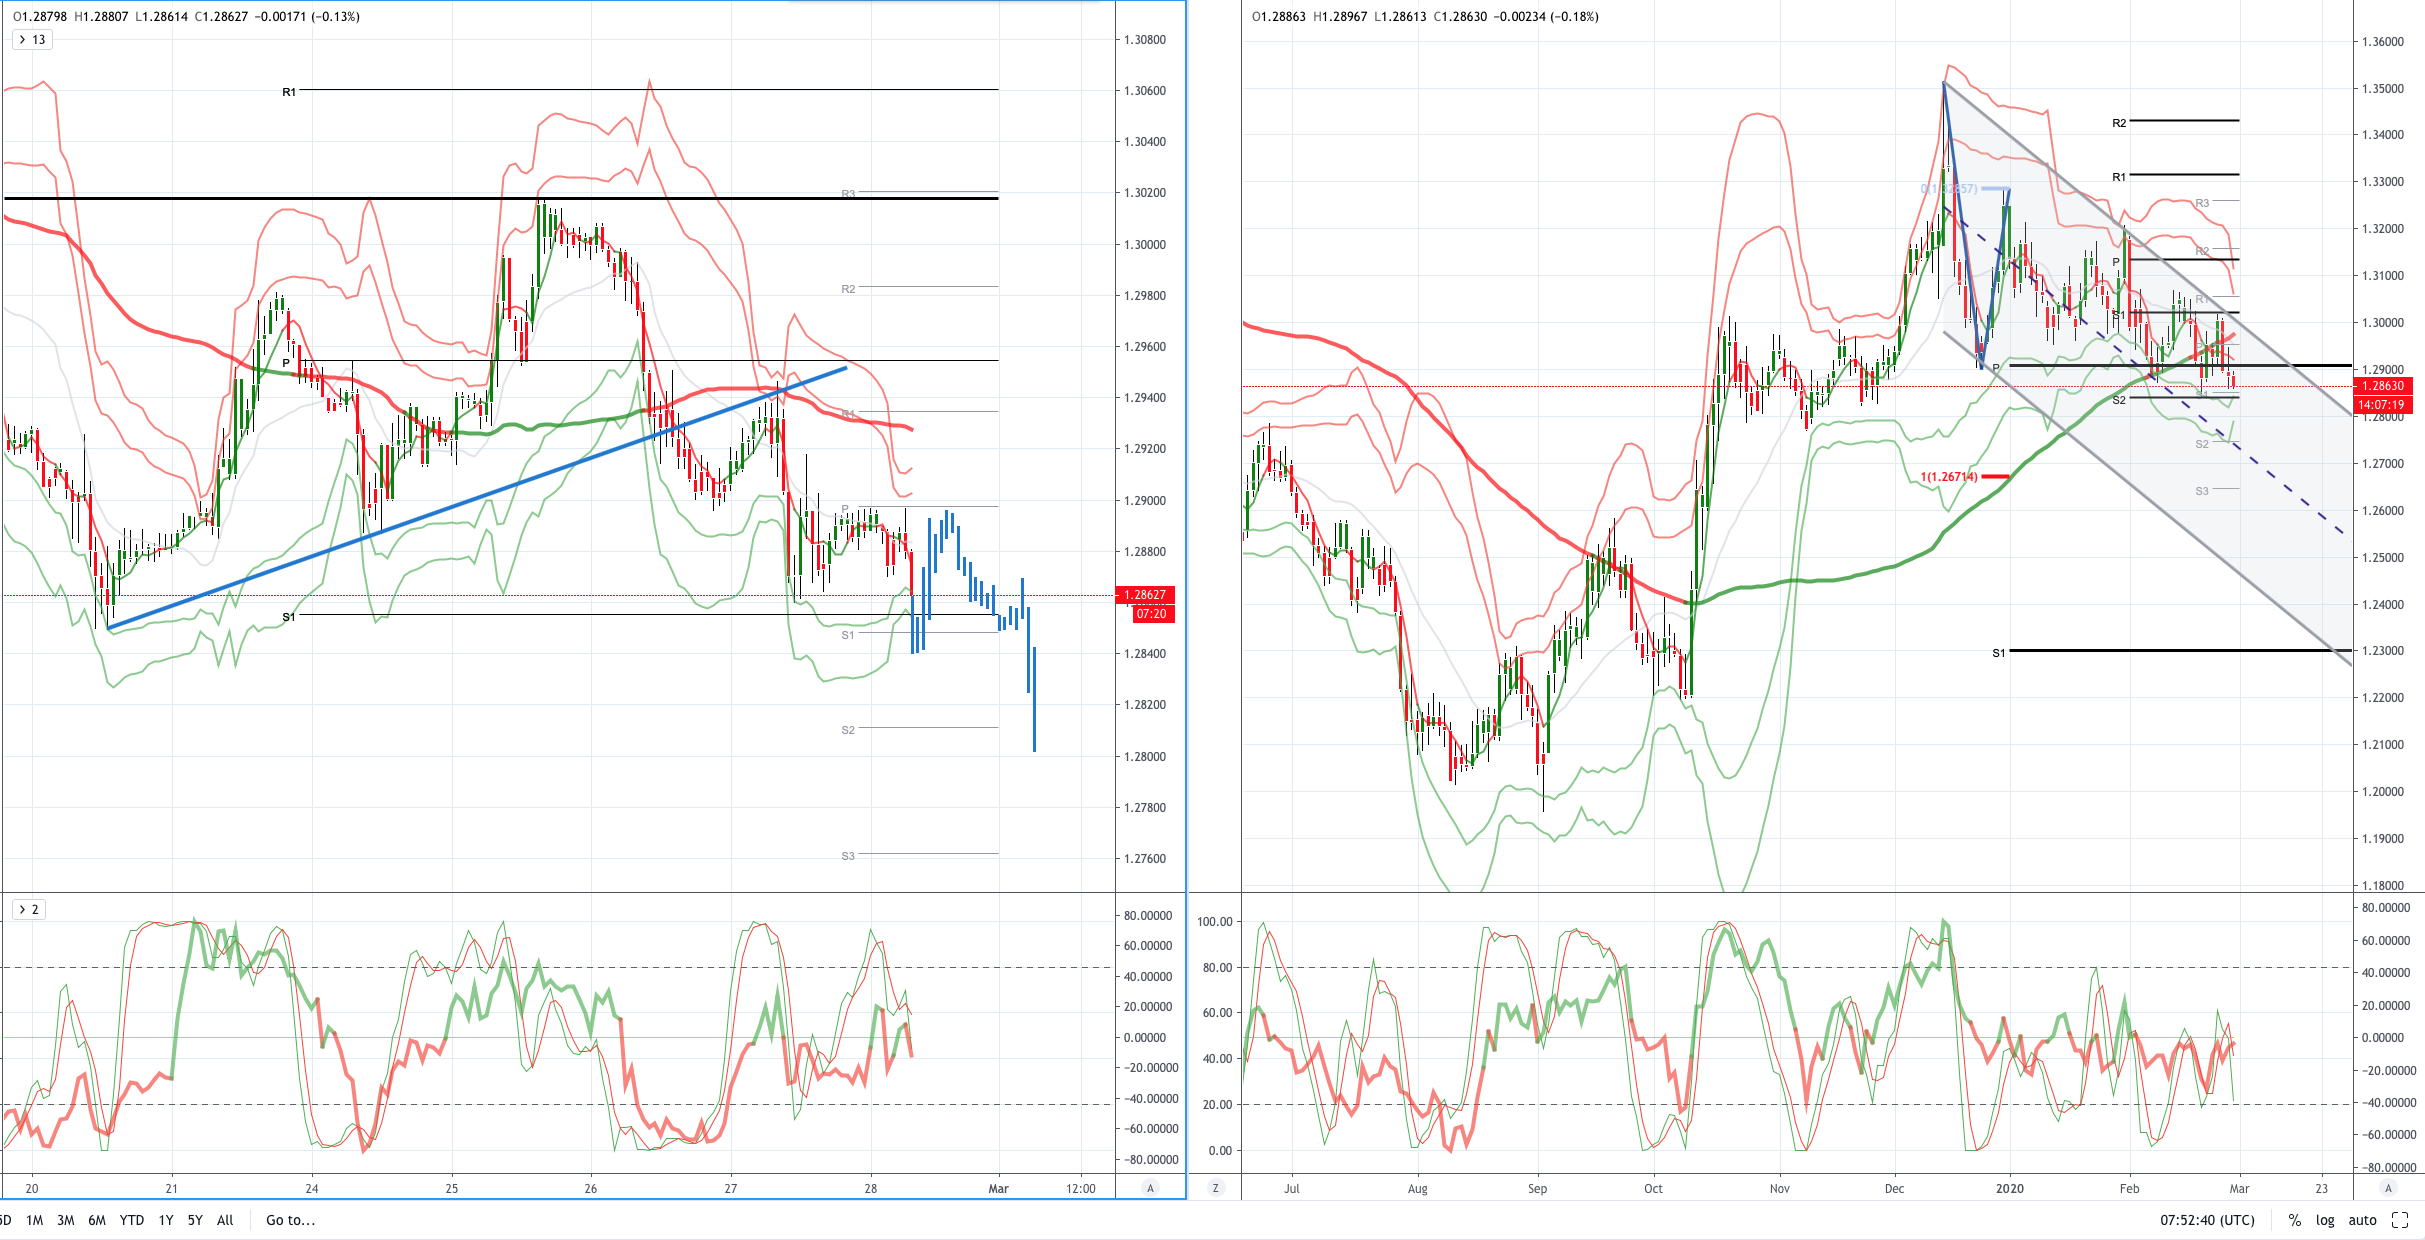
GBPUSD (Intraday bias: Bearish below 1.29 Bullish above)
GBPUSD From a technical and trading perspective, failure to recapture solid ground above 1.30 saw long liquidation, this morning 1.2950 is the major upside hurdle, as this level stands look for the retest of last weeks lows UPDATE as 1.29 caps corrections look for a test of 1.28, on the day only a close above 1.2930 would stabilise prices and delay further downside
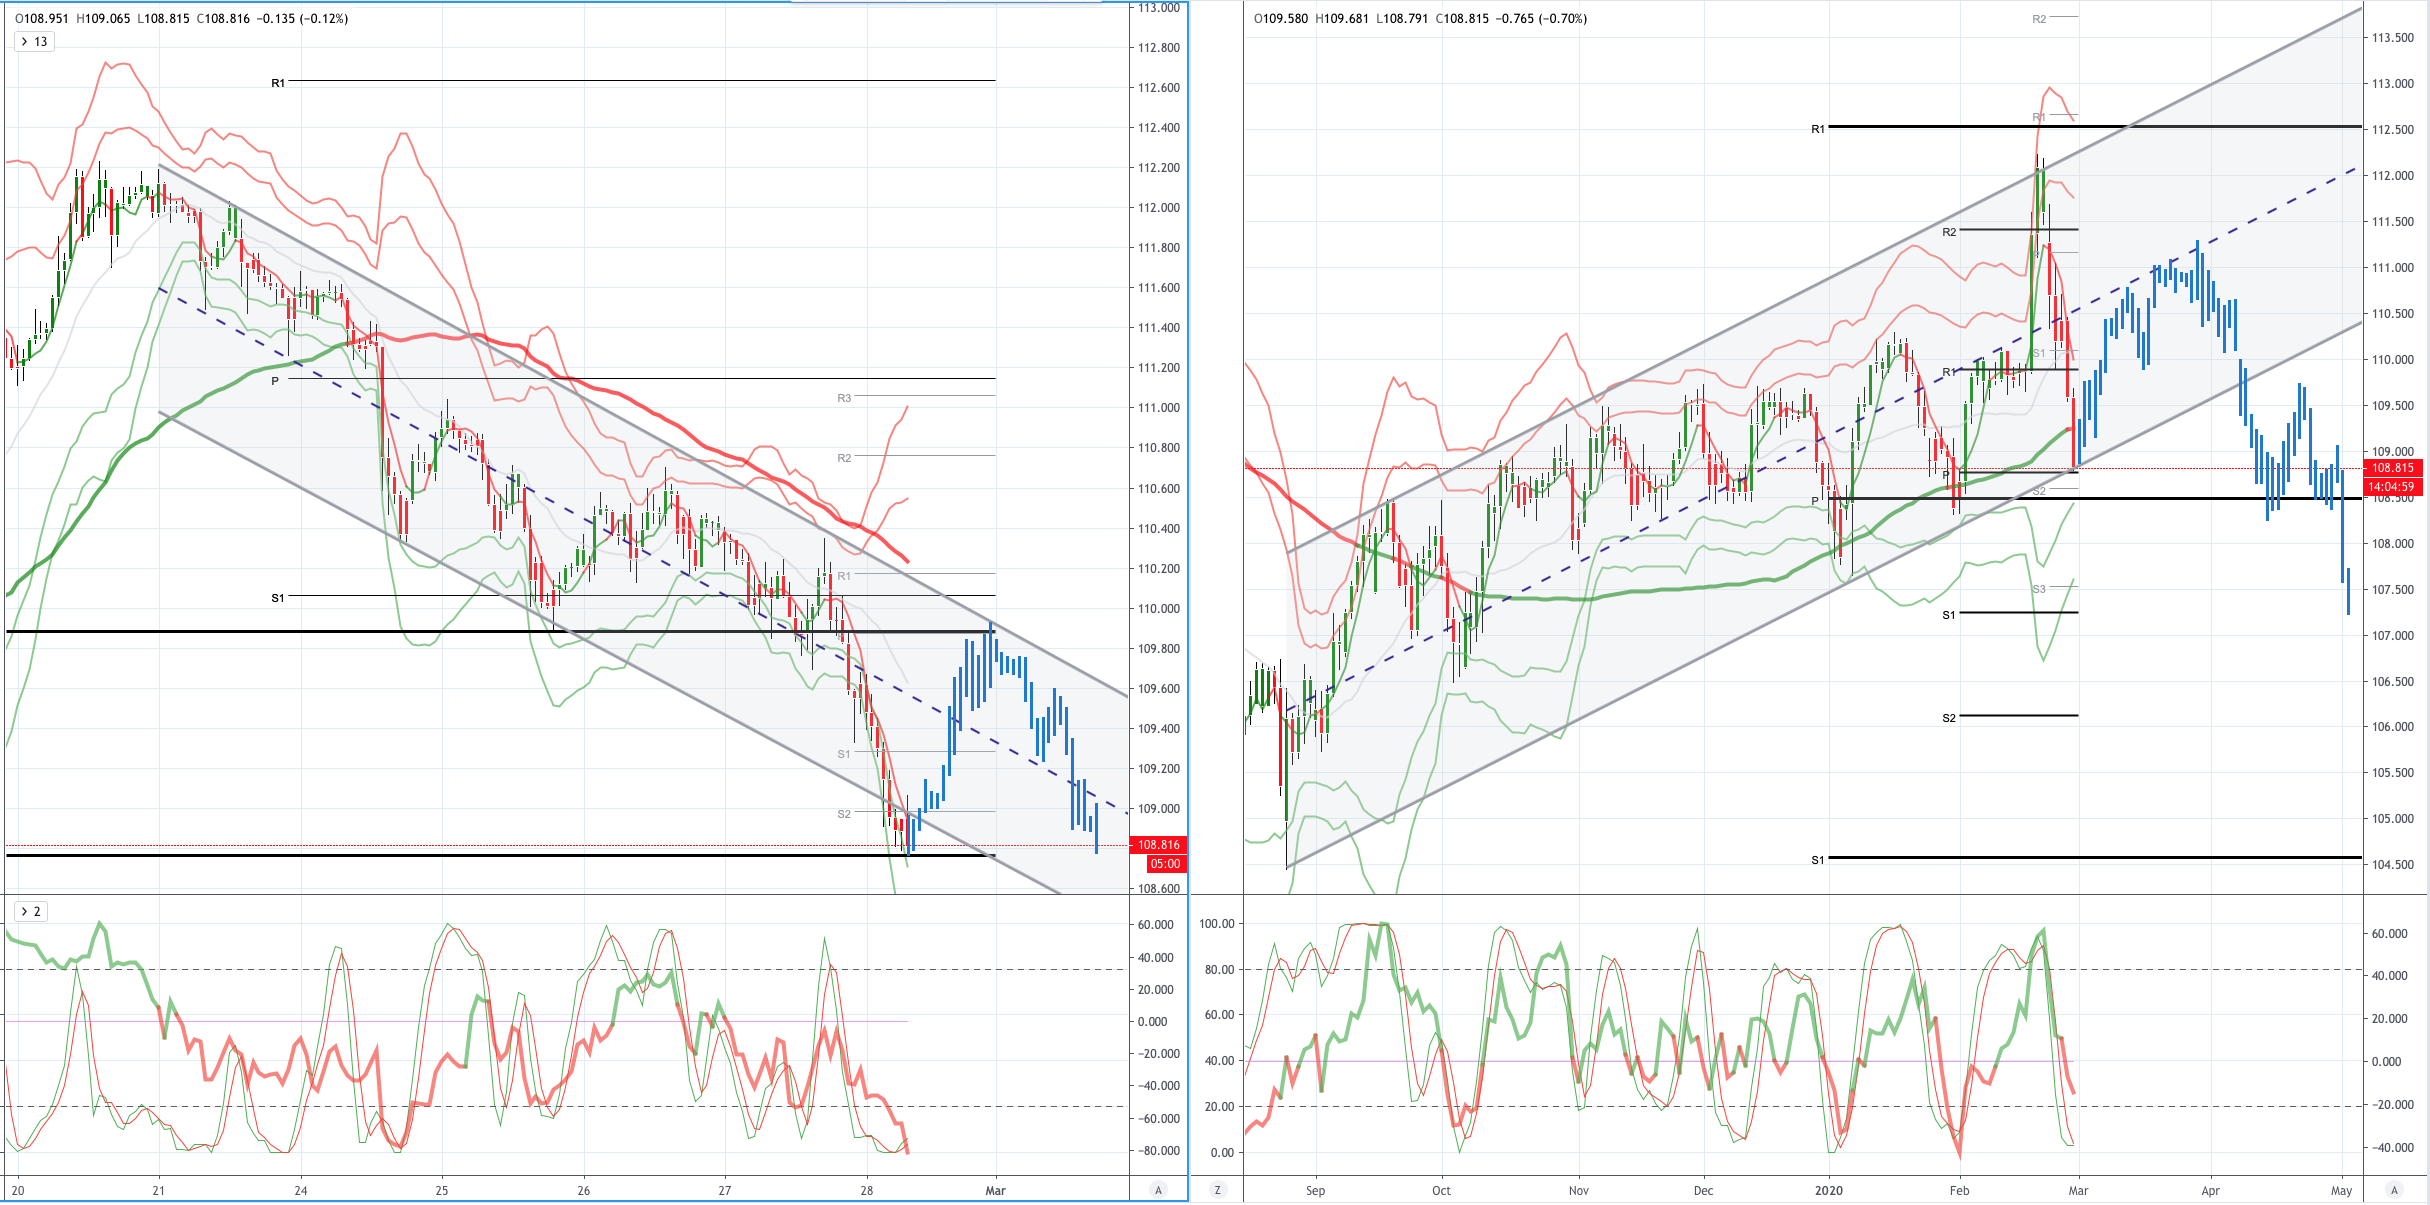
USDJPY (intraday bias: Bullish above 110.50 Bearish below)
USDJPY From a technical and trading perspective, as bulls defend yesterday's low look for a test of descending trendline resistance sighted towards 110.50 above here and 111 offers and stops will likely be tested, a failure to make ground above 110.50 will see stops taken out at yesterday's lows en-route to 109.50 UPDATE pivotal test of daily ascending trendline support as this area finds support there is an opportunity to put in a base for a retest of 110 from below. However a failure at 108.50 will expose bids and stops to 107.50
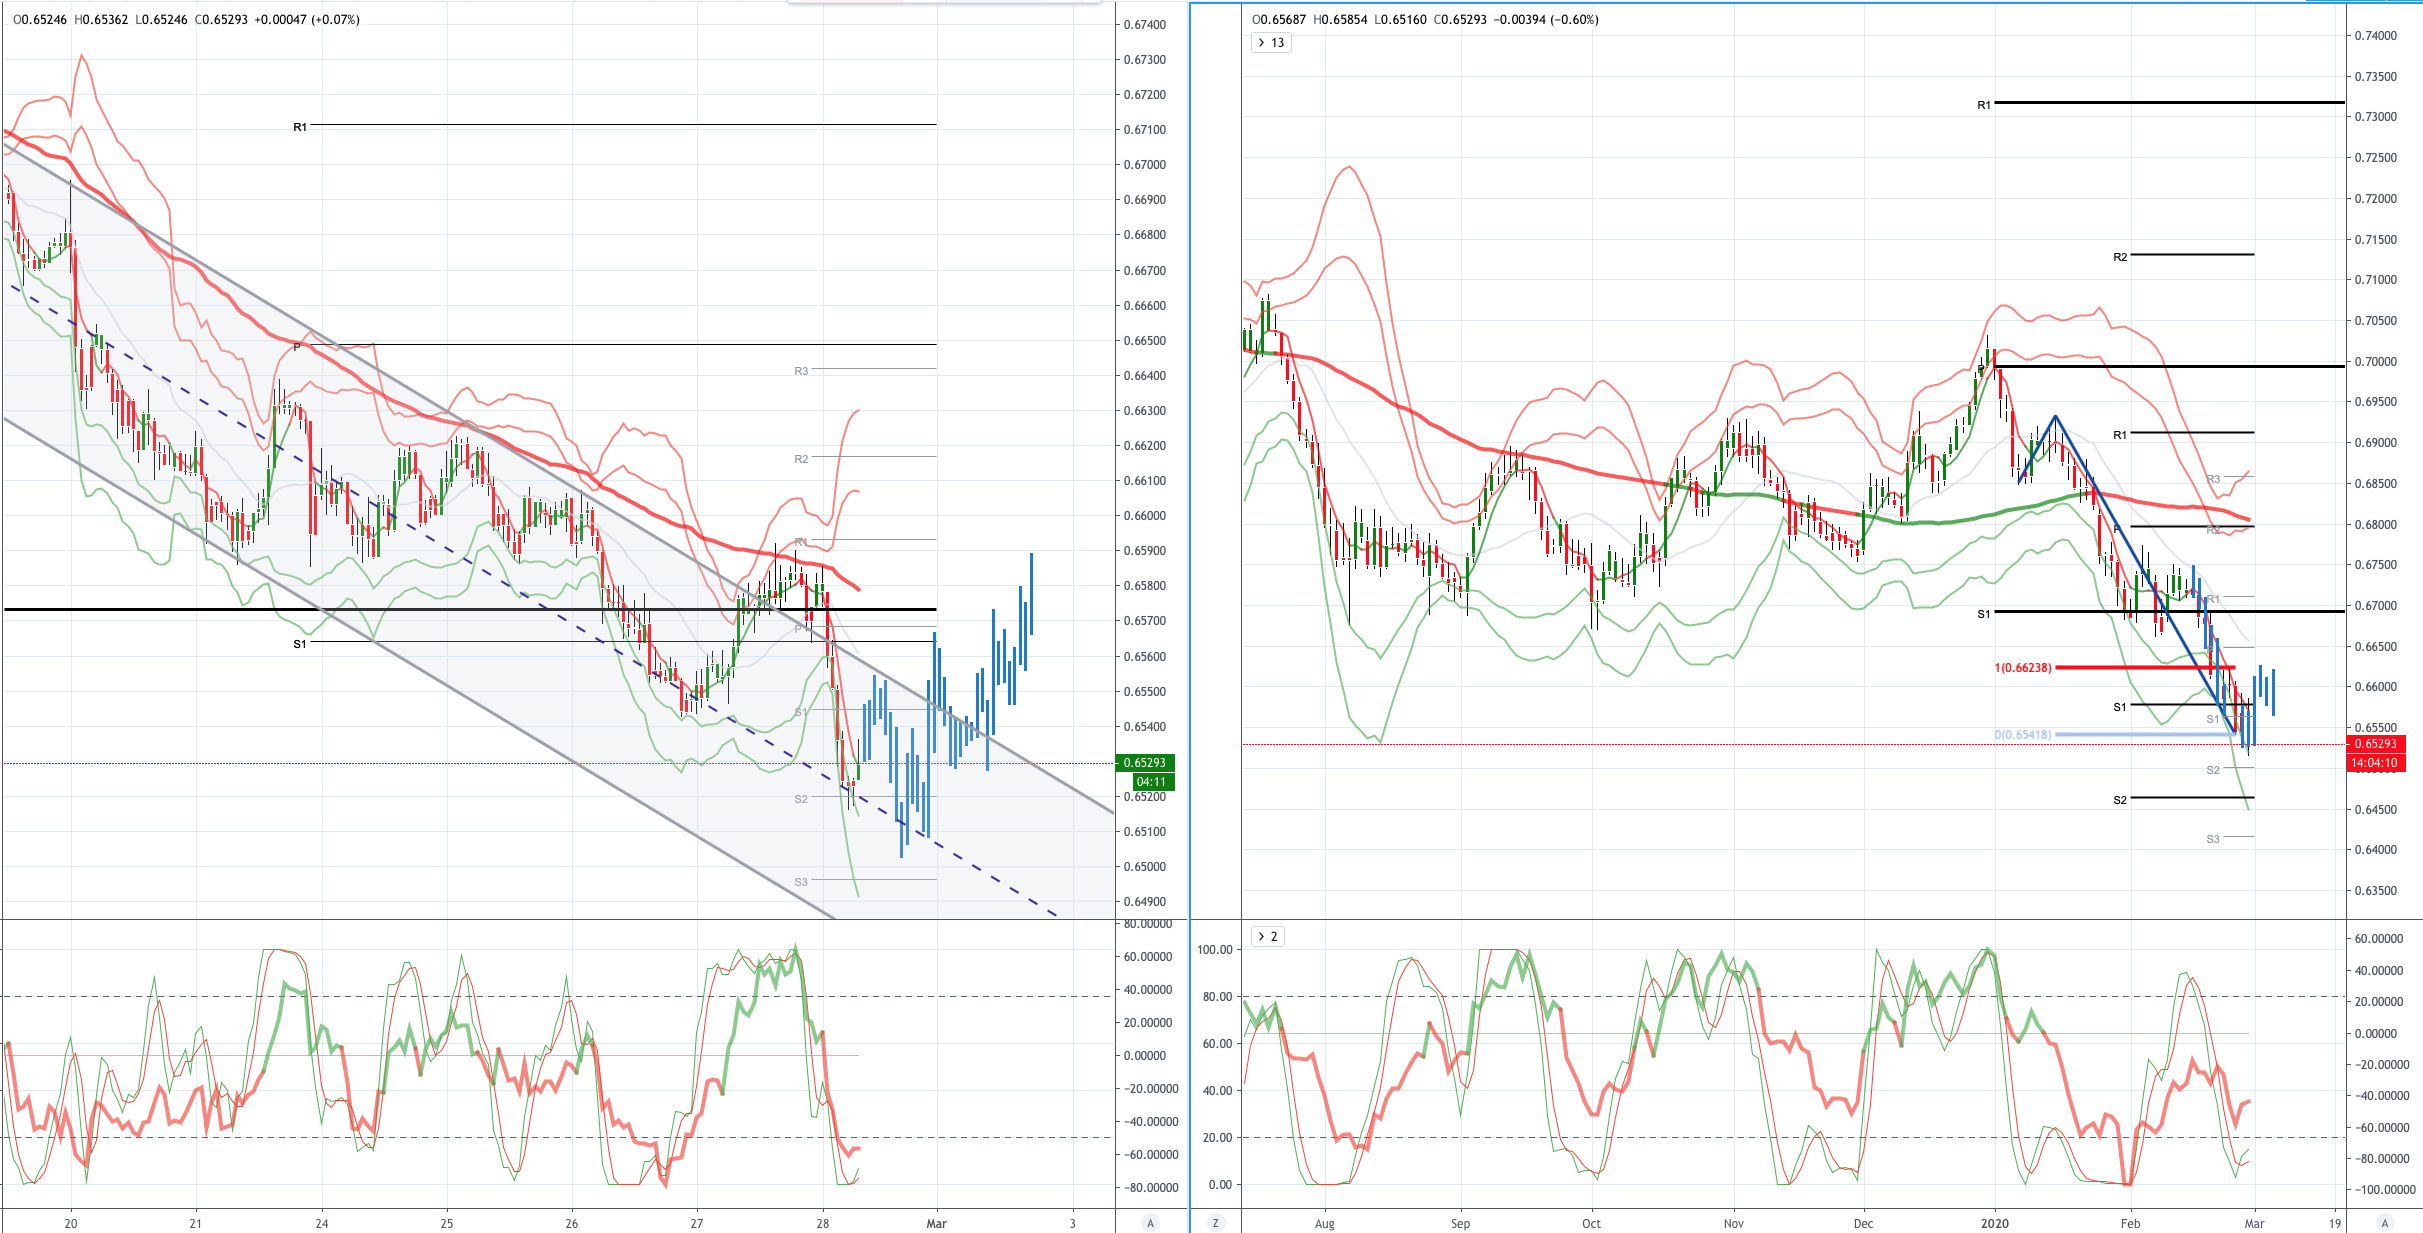
AUDUSD (Intraday bias: Bearish below .6600 Bullish above)
AUDUSD From a technical and trading perspective the equality target down to .6600 has been achieved, anticipate the potential for some profit taking around current levels, as .6570 supports we may witness an attempt to base here for a retest of offers back towards .6650. Basing attempts persist despite the overnight spike lower. UPDATE without establishing trade above .6600, bears will press for new lower ground to challenge the next figure at .6500 as .6775 contains upside attempts
Disclaimer: The material provided is for information purposes only and should not be considered as investment advice. The views, information, or opinions expressed in the text belong solely to the author, and not to the author’s employer, organization, committee or other group or individual or company.
High Risk Warning: CFDs are complex instruments and come with a high risk of losing money rapidly due to leverage. 73% and 70% of retail investor accounts lose money when trading CFDs with Tickmill UK Ltd and Tickmill Europe Ltd respectively. You should consider whether you understand how CFDs work and whether you can afford to take the high risk of losing your money.
Disclaimer: The material provided is for information purposes only and should not be considered as investment advice. The views, information, or opinions expressed in the text belong solely to the author, and not to the author’s employer, organization, committee or other group or individual or company.
Past performance is not indicative of future results.
High Risk Warning: CFDs are complex instruments and come with a high risk of losing money rapidly due to leverage. 69% and 73% of retail investor accounts lose money when trading CFDs with Tickmill UK Ltd and Tickmill Europe Ltd respectively. You should consider whether you understand how CFDs work and whether you can afford to take the high risk of losing your money.
Futures and Options: Trading futures and options on margin carries a high degree of risk and may result in losses exceeding your initial investment. These products are not suitable for all investors. Ensure you fully understand the risks and take appropriate care to manage your risk.
Patrick has been involved in the financial markets for well over a decade as a self-educated professional trader and money manager. Flitting between the roles of market commentator, analyst and mentor, Patrick has improved the technical skills and psychological stance of literally hundreds of traders – coaching them to become savvy market operators!