Dollar Rises on Strong Data, Technicals Signal Near Pullback Point

The latest data on the American economy show that it is growing significantly faster than previously thought: over the past two weeks, the estimate of the quarterly GDP growth rate, calculated by the New York Federal Reserve, has been revised upwards by almost 1% - from 2.42% to 3.31%:
This reassessment was driven by four key reports: NFP, January consumer spending, PMI for services and manufacturing, as well as real GDP for the fourth quarter of 2023. All four indicators significantly exceeded expectations.
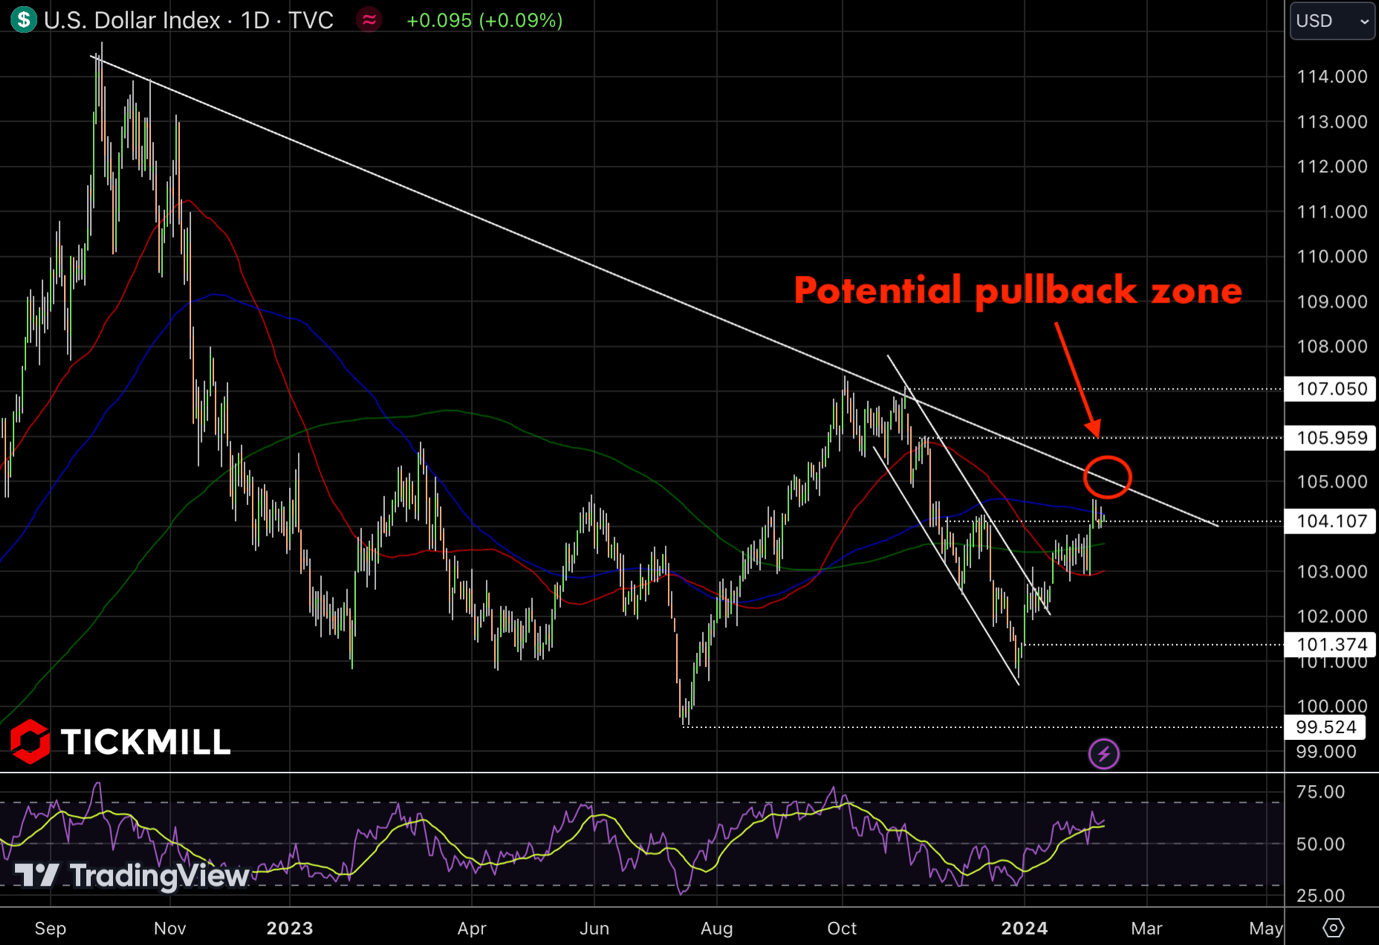
Against the backdrop of improvements in the data, the dollar has launched a major offensive. On the daily chart of the DXY (dollar index), one can see how the price reversed in late December of last year. Classic for market price dynamics at the beginning of the year. The strengthening of the dollar reflects a higher potential for the US economy compared to other economies, and given that some market participants are still trying to attribute positive surprises to a temporary phenomenon, the growth is clearly not exhausted. In an attempt to identify the point where growth will at least slow down, one can turn to technical analysis: a rebound could occur in the area of the trend line formed by the two previous peaks - in October 2022 and October 2023. This will roughly correspond to the level of 105 on the DXY:

It turns out that the decline of the major pairs EURUSD and GBPUSD may continue: to 1.0680-1.0690 for the first pair and 1.24 for the second. The catalyst for movement could be the CPI for January, which will be released next week, February 13th. Preliminary data, including a sharp increase in jobs in January and wages, suggest that the risks are skewed towards higher CPI values than forecast (core inflation 0.3% m/m).
But before the CPI, markets may pay attention to the BLS annual report on seasonal adjustments to inflation. The release is scheduled for today. Since seasonality is not taken into account in the calculation of annual inflation indicators, there will be no changes to them. But when it comes to monthly inflation figures, seasonality begins to be taken into account, so the monthly inflation rates for November and December of last year may be revised. Considering that the basis for optimistic market sentiments is precisely the surprises of the last two months, including inflation indicators, the market is likely to be sensitive to surprises in the data today. It is worth noting, for example, that adjustments for last year showed that inflation growth rates in the second half of the year were underestimated, leading to the conclusion that the Fed needs to make more efforts to contain inflation. Therefore, today's report may have important implications for both Fed policy and market prices.
Disclaimer: The material provided is for information purposes only and should not be considered as investment advice. The views, information, or opinions expressed in the text belong solely to the author, and not to the author’s employer, organization, committee or other group or individual or company.
Past performance is not indicative of future results.
High Risk Warning: CFDs are complex instruments and come with a high risk of losing money rapidly due to leverage. 72% and 73% of retail investor accounts lose money when trading CFDs with Tickmill UK Ltd and Tickmill Europe Ltd respectively. You should consider whether you understand how CFDs work and whether you can afford to take the high risk of losing your money.
Futures and Options: Trading futures and options on margin carries a high degree of risk and may result in losses exceeding your initial investment. These products are not suitable for all investors. Ensure you fully understand the risks and take appropriate care to manage your risk.
