EUR/USD is testing different levels!
EUR/USD
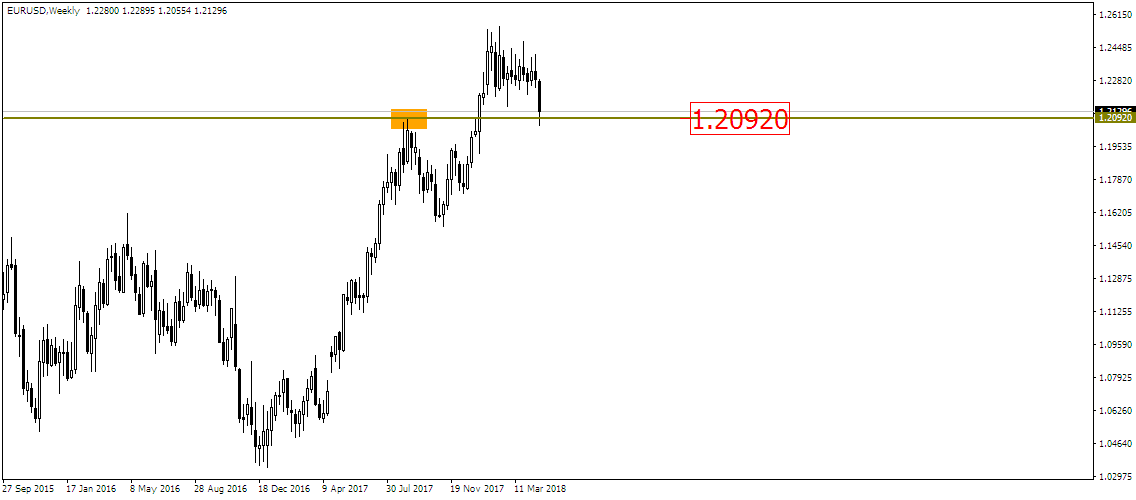
The EURO rate has touched the broken level of 1.2092 in the weekly chart:
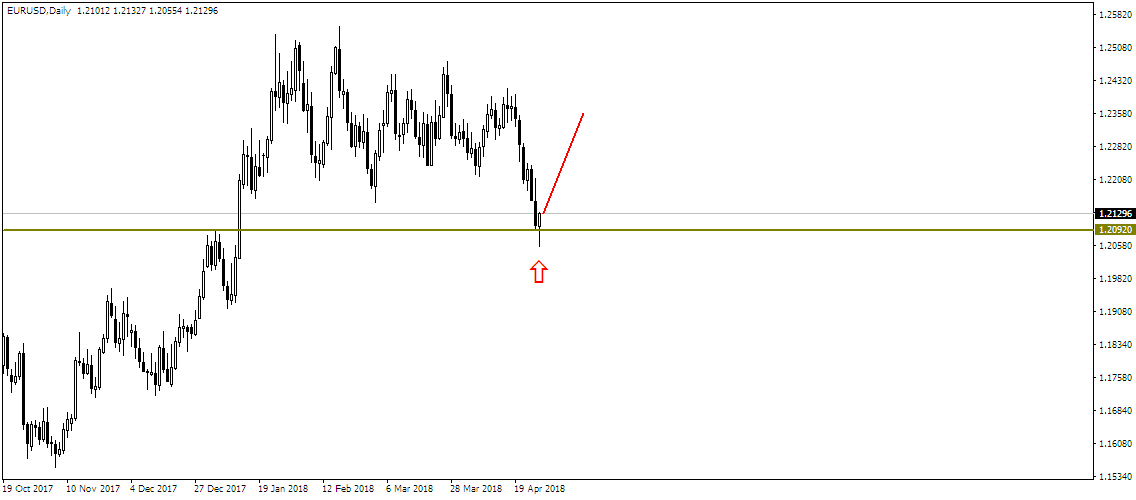
In the daily chart, the pair has formed a hammer at the horizontal level. It means that the pair might very well head in the case of great resistance:
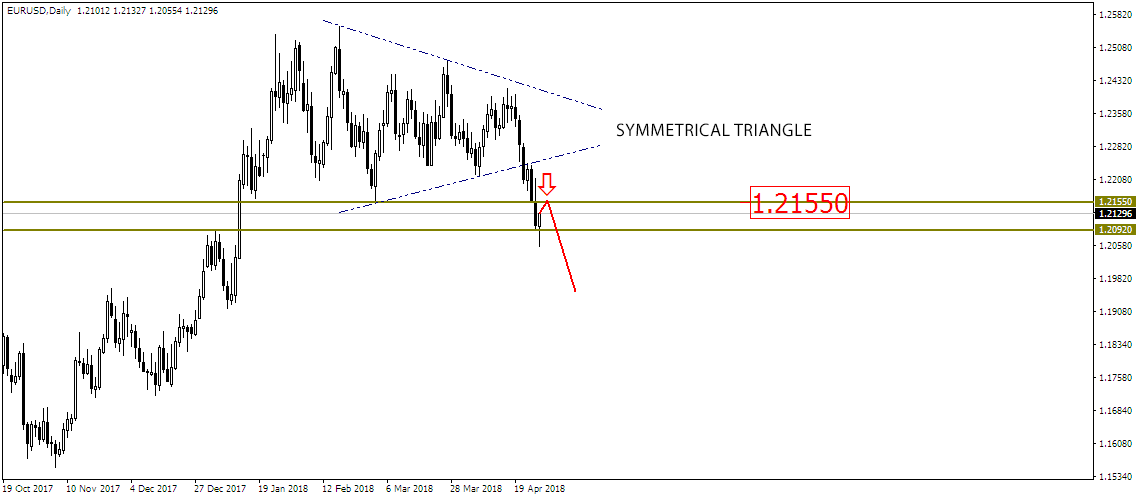
There is also a 1.2155 level that we should take into consideration. But it is wise to wait for Monday session’s closure to figure out when this level will really get broken. So, we should wait for three candles to close beyond the broken trendline:
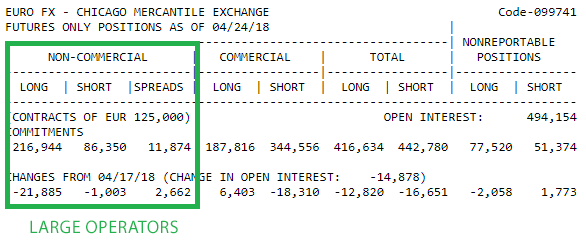
Reports provided by COT CFTC show interesting data. Large operators prefer to go long rather than short, yet last week they were actively reducing their long positions. It might mean that trend can reverse:
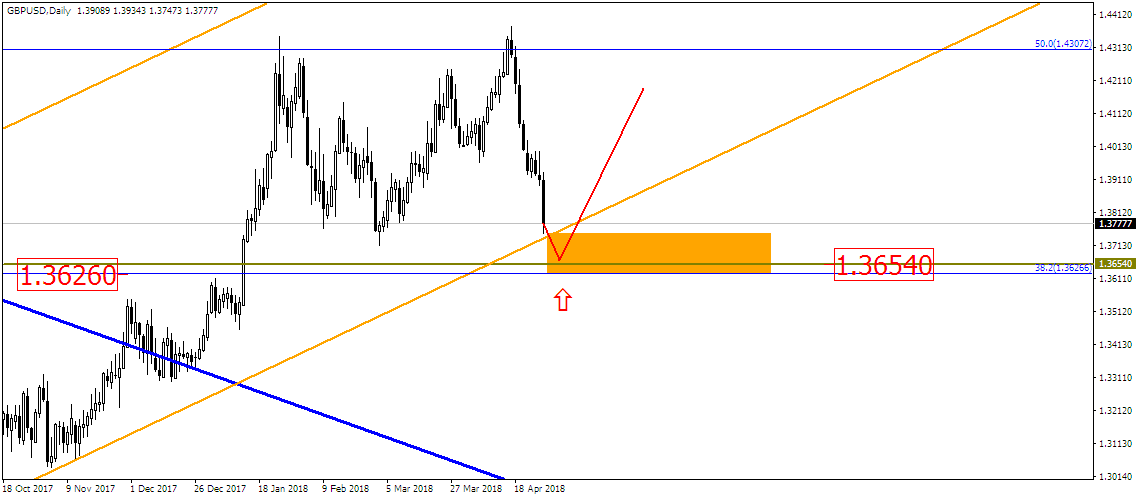
GBP/USD
In the weekly chart, the British currency approached an ascending channel. The level 1.3654 is passing through that channel too:
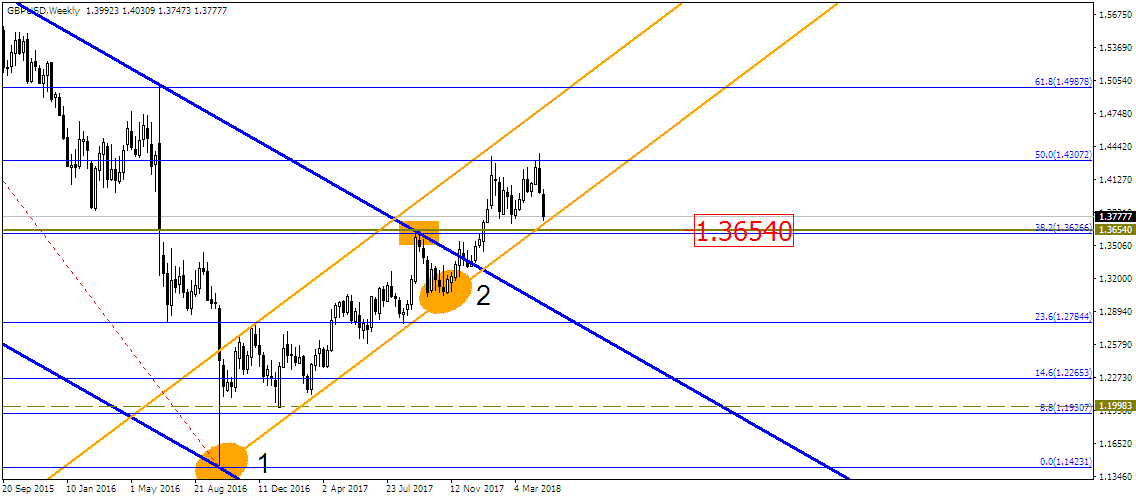
So, the pair might pull back from the support zone of 1.3660-1.3745, which is denoted by the orange triangle in the chart:
Disclaimer: The material provided is for information purposes only and should not be considered as investment advice. The views, information, or opinions expressed in the text belong solely to the author, and not to the author’s employer, organization, committee or other group or individual or company.
Past performance is not indicative of future results.
High Risk Warning: CFDs are complex instruments and come with a high risk of losing money rapidly due to leverage. 69% and 73% of retail investor accounts lose money when trading CFDs with Tickmill UK Ltd and Tickmill Europe Ltd respectively. You should consider whether you understand how CFDs work and whether you can afford to take the high risk of losing your money.
Futures and Options: Trading futures and options on margin carries a high degree of risk and may result in losses exceeding your initial investment. These products are not suitable for all investors. Ensure you fully understand the risks and take appropriate care to manage your risk.