Financial Markets Update: Gold's Technical Chart Signals Potential Downside, Hawks Gain Momentum
After a fragile and fleeting Monday equilibrium following the "balanced" statement by the head of the Federal Reserve, Powell, the markets have once again begun reassessing the chances of a rate hike in June. Gold prices have declined, US Treasury bond yields have risen, and the dollar is growing. An interesting technical setup is being formed on the gold price chart:
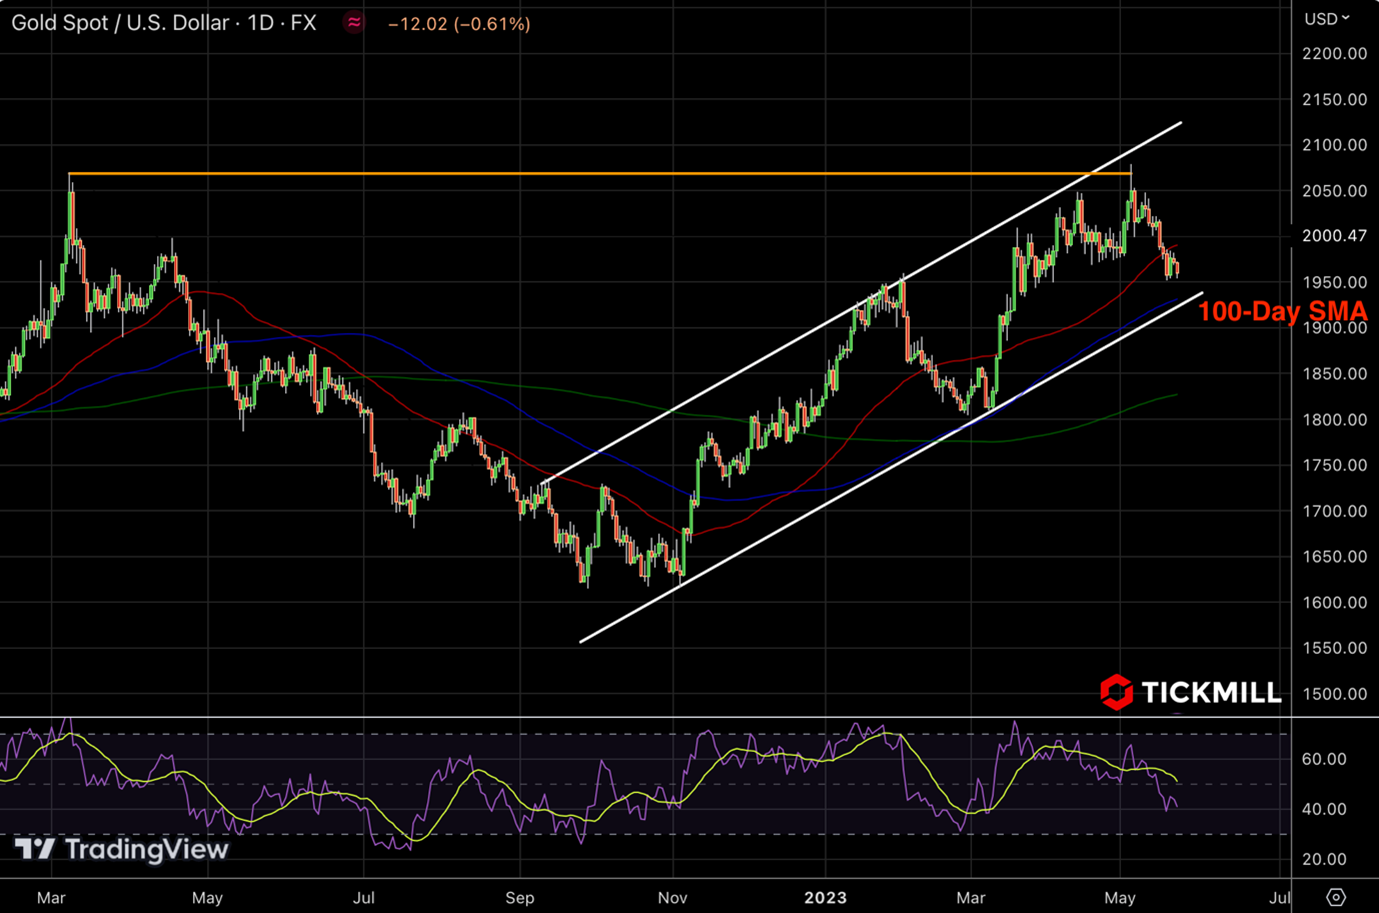
The first thing that catches the eye is a very clearly formed ascending channel, which increases the probability of channel boundaries being tested as support and resistance zones (as a significant number of market participants are likely to see the same on the chart). In early May, the gold rally encountered resistance near the upper boundary of the trend corridor, which coincided with the historical high formed in March 2022. Subsequently, the price entered a correction phase. There was a retest of the 1950 zone, followed by a rebound after Powell's statement on Friday, which, judging by the subsequent downward movement, was used as an opportunity to short on the retracement. There is a high probability that there will be a retest of the 1950 zone followed by a downward breakthrough, after which the obvious target will be the lower boundary of the channel in combination with the 100-day moving average (represented by the blue curve on the chart). This corresponds approximately to the zone of $1925-1930 on the chart.
Now, let's discuss why there is growing excitement among hawks. Yesterday, two other top Federal Reserve officials, Kashkari and Bullard, expressed clear hawkish inclinations in their comments. Kashkari mentioned the possibility of raising the rate to 6%. Bullard effectively stated that he would vote for at least another 50 basis points of rate hikes this year, as more efforts would be required if inflation were to accelerate again, compared to overshooting with tightening.
Jamie Dimon, the CEO of JP Morgan, called for preparing for higher rates this year, while BlackRock changed its outlook on credit instruments from "overweight" to "neutral," apparently anticipating pressure on credit papers due to potentially higher rates.
Earlier, two other representatives of the Federal Reserve, Logan and Jefferson, also made explicit calls to raise the rate.
A similarly interesting situation has developed for the USD/CAD pair:
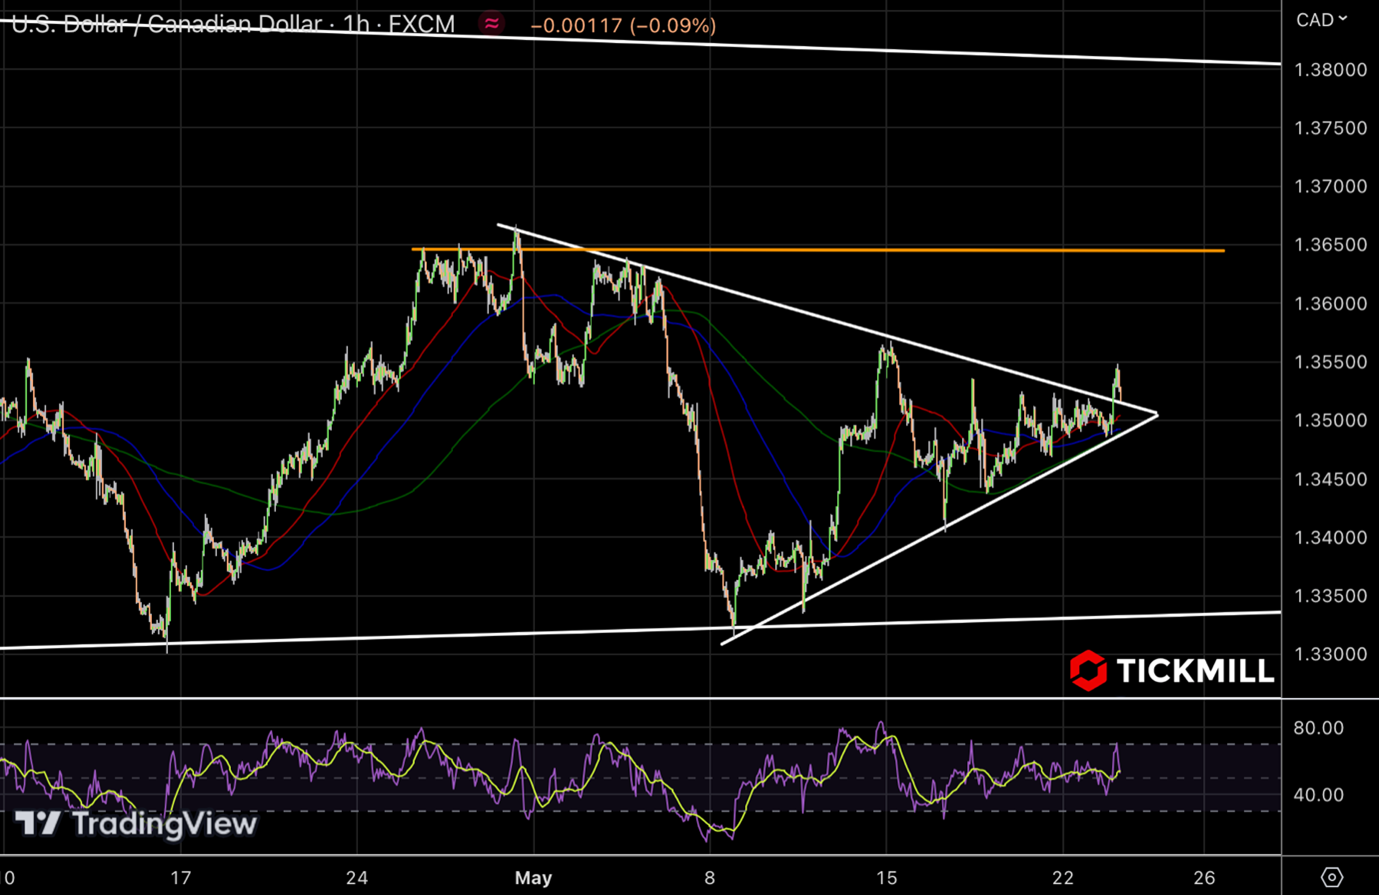
After a period of one-week consolidation near the 1.35 level, forming a triangle pattern, the price broke above the upper boundary and tested the 1.3550 level. A similar triangle pattern has formed on the WTI chart since the beginning of May, but the price seems to be heading upward ahead of the OPEC+ meeting in early June. The Saudi Arabian Energy Minister warned speculators this week that being short on oil positions may end poorly for them, as it did in April. Speculators' short positions in oil futures have reached their highest level since 2020, increasing the chances of a short squeeze if OPEC+ announces another production cut. However, before the OPEC meeting, there are expected to be several events related to Federal Reserve policy (Core PCE, FOMC meeting minutes), so there may be developments regarding the USD/CAD pair, with a move towards 1.36 and then a correction downward on strengthening oil prices.
Today's economic calendar is not particularly interesting. The activity indices in the manufacturing and services sectors of the Eurozone indicate continued weakness in the industry, with moderate expansion in the services sector. This has negative implications for the Euro, as it is an export-oriented economy (contributing 50% to GDP), and foreign currency supply is shrinking. Later, data on activity in the US manufacturing and services sectors will be released by S&P Global, as well as data on new home sales in the US. Additionally, Fed official Logan will make comments.
Disclaimer: The material provided is for information purposes only and should not be considered as investment advice. The views, information, or opinions expressed in the text belong solely to the author, and not to the author’s employer, organization, committee or other group or individual or company.
Past performance is not indicative of future results.
High Risk Warning: CFDs are complex instruments and come with a high risk of losing money rapidly due to leverage. 69% and 73% of retail investor accounts lose money when trading CFDs with Tickmill UK Ltd and Tickmill Europe Ltd respectively. You should consider whether you understand how CFDs work and whether you can afford to take the high risk of losing your money.
Futures and Options: Trading futures and options on margin carries a high degree of risk and may result in losses exceeding your initial investment. These products are not suitable for all investors. Ensure you fully understand the risks and take appropriate care to manage your risk.