Gold’s Symmetrical Triangle Offers A Puzzling Future: What’s Next?
Good day!
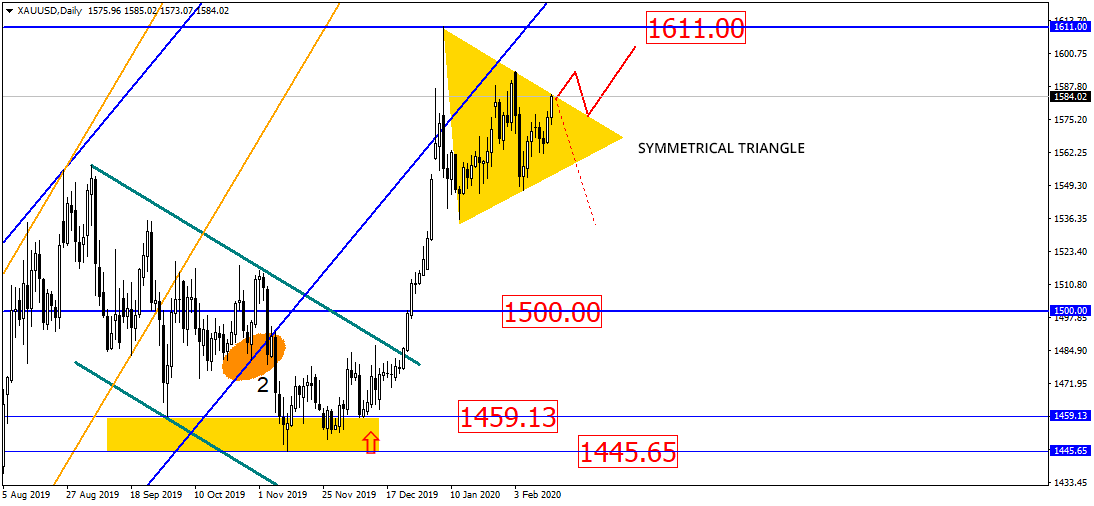
In the daily chart, gold has formed a symmetrical triangle which could get broken from any side. Let’s wait for the true breakout of this figure to happen for us to understand if it can move forward or reverse the current trend:
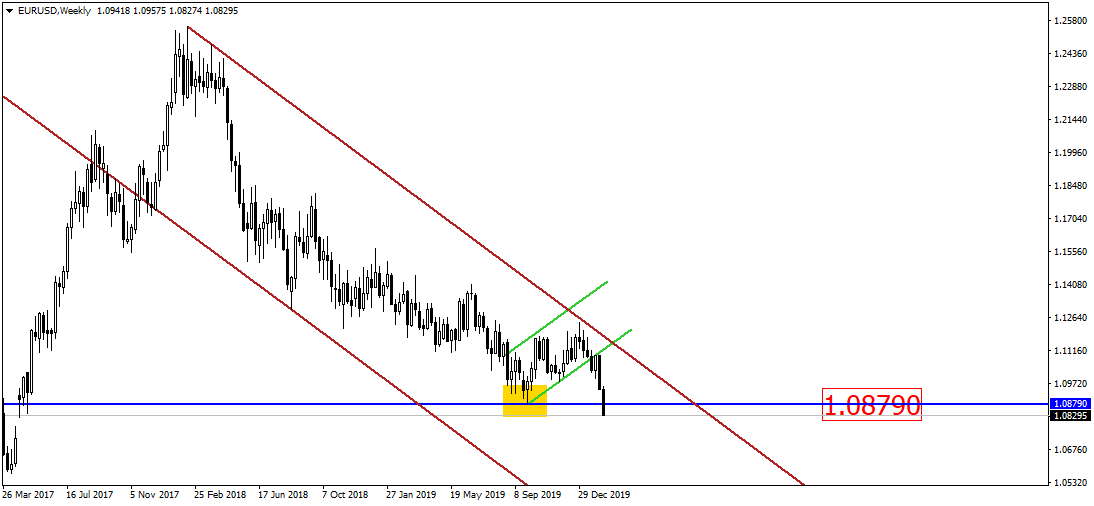
The European currency broke the 1.0879 level. This could signify the potential drop of the currency pair. Moreover, it could be likely to happen anytime soon:
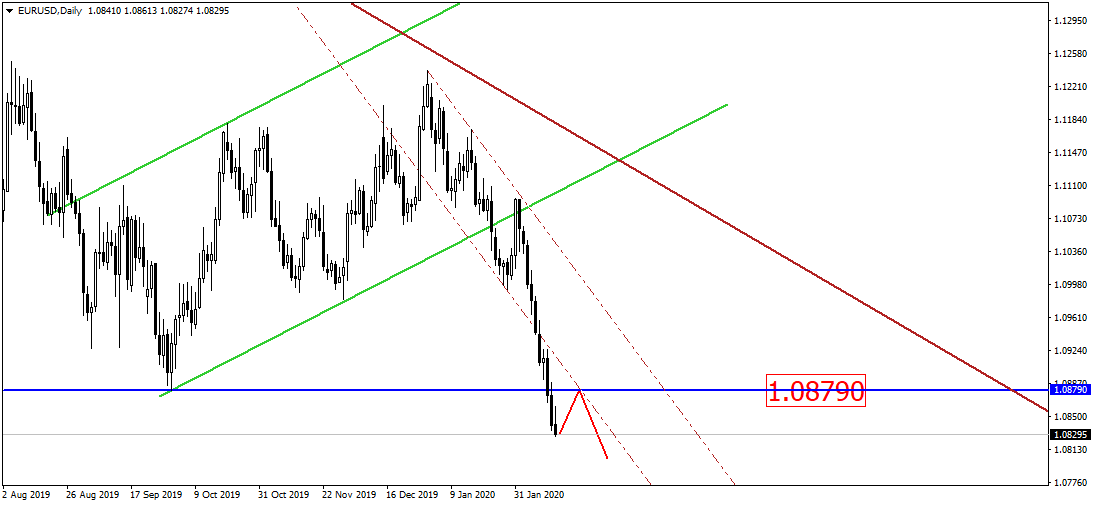
As can be seen from the daily EUR/USD chart, the 1.0879 level may provide some resistance and push the prices down:
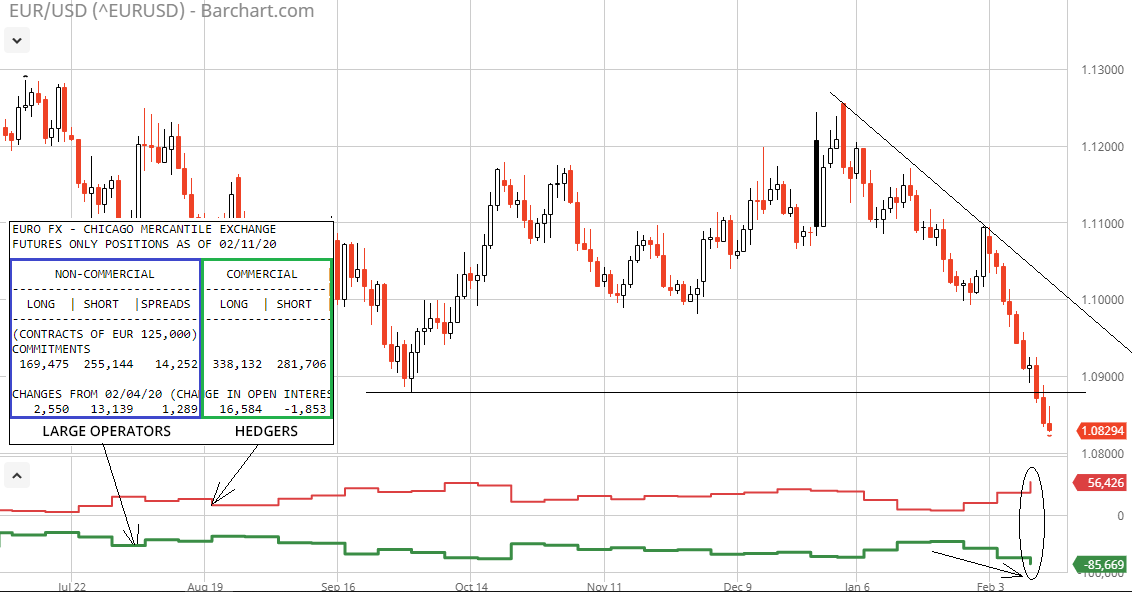
Based on the latest data provided by COT CFTC, large operators keep going short for the third week in a row. This is a true trend that could indirectly prove the scenarios occurring on the charts above:
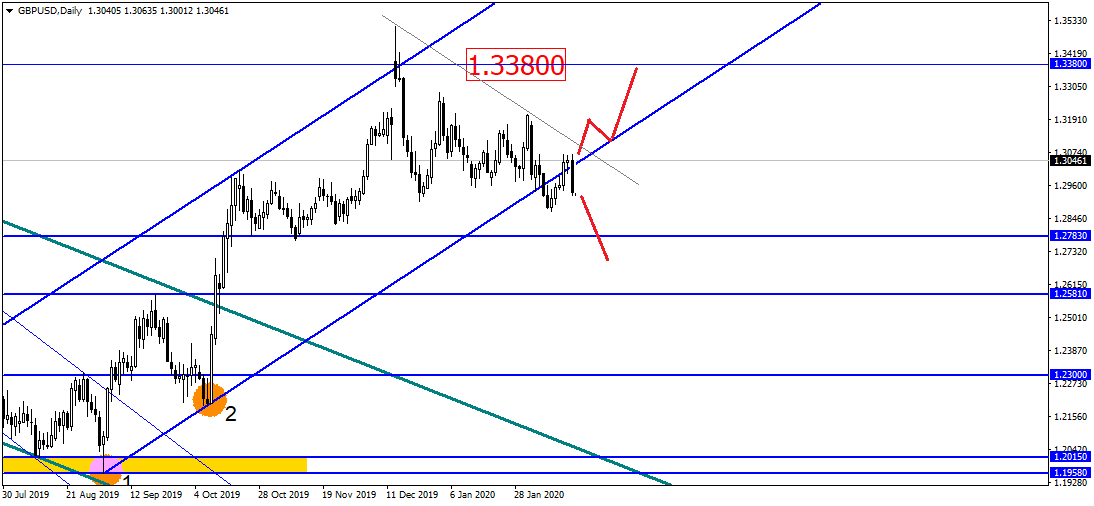
The British pound got back into the broken uptrend and closed a second candle in it. So, the asset could potentially close tomorrow’s trading session with a black candle as in the chart below and drop. Should the asset close in the trend, the currency pair might repeatedly approach the 1.3380 level:
Let us remind you that this material is provided for informative purposes only and cannot be considered as a direct go ahead to implement transactions in the financial markets. Trading in the financial markets is very risky.
Disclaimer: The material provided is for information purposes only and should not be considered as investment advice. The views, information, or opinions expressed in the text belong solely to the author, and not to the author’s employer, organization, committee or other group or individual or company.
Past performance is not indicative of future results.
High Risk Warning: CFDs are complex instruments and come with a high risk of losing money rapidly due to leverage. 69% and 73% of retail investor accounts lose money when trading CFDs with Tickmill UK Ltd and Tickmill Europe Ltd respectively. You should consider whether you understand how CFDs work and whether you can afford to take the high risk of losing your money.
Futures and Options: Trading futures and options on margin carries a high degree of risk and may result in losses exceeding your initial investment. These products are not suitable for all investors. Ensure you fully understand the risks and take appropriate care to manage your risk.