Institutional Insights: BofA Sell Side Indicator
Strategists hold steady with stocks at an all-time high
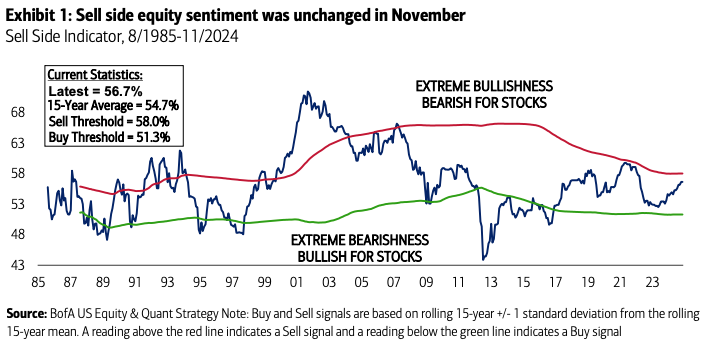
Equity sentiment unchanged post-election The Sell Side Indicator (SSI) is our contrarian sentiment signal that tracks sell side strategists’ average recommended allocation to equities in a balanced fund. The indicator was unchanged at 56.7% in November, remaining at its highest level since early 2022. Strategists held their allocations steady despite the S&P 500 posting its best month of the year in November (+5.9%), closing at a fresh all-time high. The pause in sell side equity sentiment post-election may reflect a mixed perception of policy impacts under Trump 2.0, with greater inflation and rates uncertainty weighing against optimism around de-regulation, lower taxes and pro-growth policy. “Neutral” signal, but closer to “Sell” than “Buy” The SSI has been a reliable contrarian indicator. In other words, it has been bullish when Wall Street was extremely bearish and vice versa.
Our indicator remains in “Neutral” territory but is much closer to a contrarian “Sell” signal than a “Buy” (1.4ppt vs. 5.4ppt). Its current level of 56.7% suggests a price return of 11% for the S&P 500 over the next 12 months, one of five inputs we used to launch our 2025 year-end target of 6666. Stick with stocks > bonds Bond sentiment soured this year amid massive underperformance, with the S&P 500 leading long-term treasuries by nearly 30ppt YTD. The average recommended bond allocation fell by 2.9ppt, largely to the benefit of equities (+2.0ppt). Although equity sentiment and valuation are currently elevated, we still see ample reason to stick with stocks over bonds for the long-term. For the equalweighted S&P 500, valuation points to healthy price returns of 5-6% per year over the next decade (and more with dividends). Meanwhile, treasuries face waning foreign demand and growing sovereign risk as US debt/GDP continues to rise.

Disclaimer: The material provided is for information purposes only and should not be considered as investment advice. The views, information, or opinions expressed in the text belong solely to the author, and not to the author’s employer, organization, committee or other group or individual or company.
Past performance is not indicative of future results.
High Risk Warning: CFDs are complex instruments and come with a high risk of losing money rapidly due to leverage. 71% and 74% of retail investor accounts lose money when trading CFDs with Tickmill UK Ltd and Tickmill Europe Ltd respectively. You should consider whether you understand how CFDs work and whether you can afford to take the high risk of losing your money.
Futures and Options: Trading futures and options on margin carries a high degree of risk and may result in losses exceeding your initial investment. These products are not suitable for all investors. Ensure you fully understand the risks and take appropriate care to manage your risk.
Patrick has been involved in the financial markets for well over a decade as a self-educated professional trader and money manager. Flitting between the roles of market commentator, analyst and mentor, Patrick has improved the technical skills and psychological stance of literally hundreds of traders – coaching them to become savvy market operators!