Is Gold Getting Ready to Drop?
Good day!
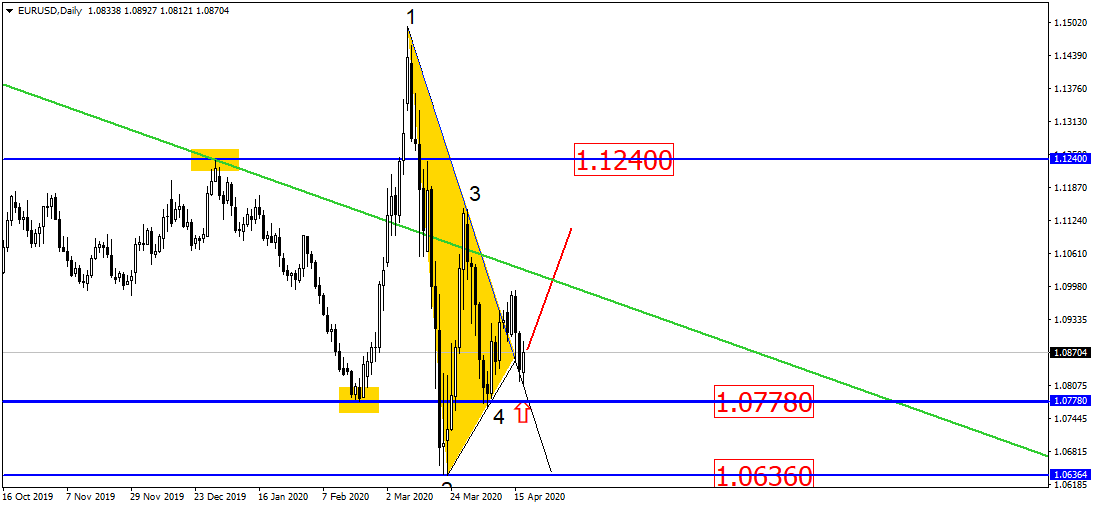
On Friday’s EUR/USD chart a white candle has formed on a side of the broken triangle, absorbing half of the black one. This asset could indicate a potential jump when the markets open:
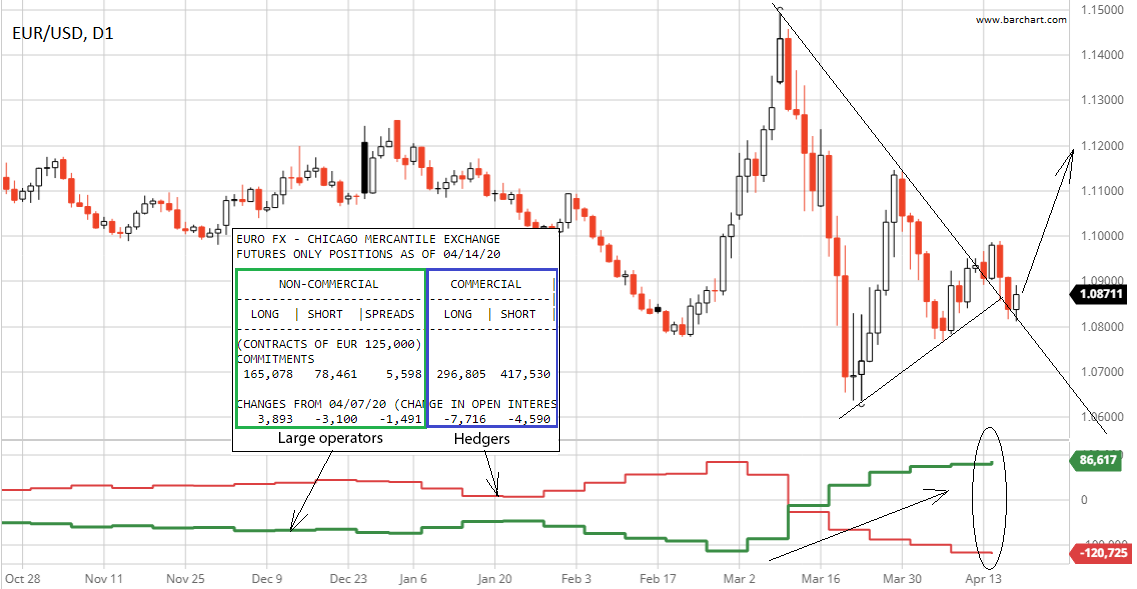
Based on the latest data by COT CFTC, large operators keep expanding long positions and decreasing the short ones. At that, the net position (Long-Short) continues to grow as it has for many weeks so far. This position has now reached the new maximum of 86,617. A possible indicators that that the market could grow:
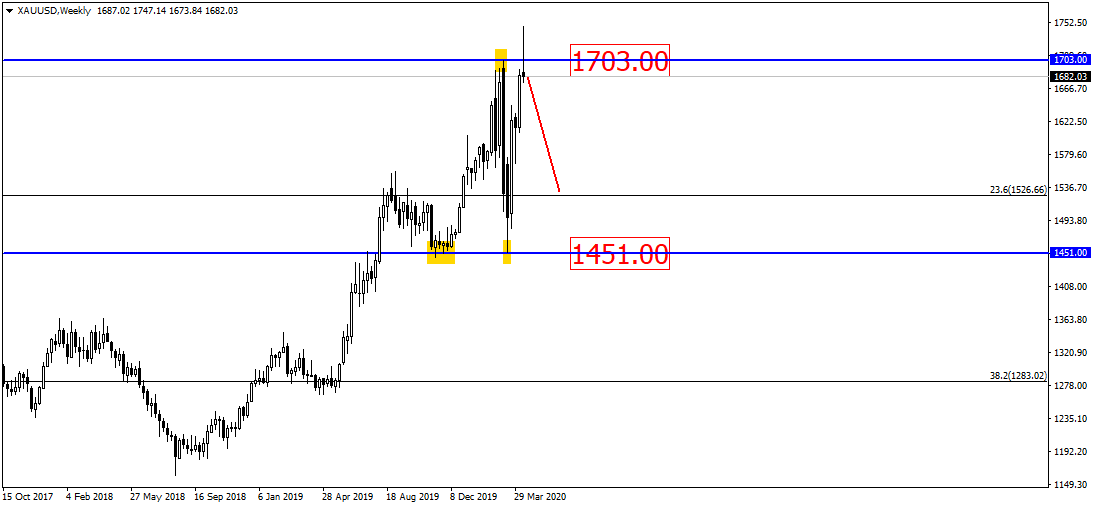
In the weekly chart, gold price has formed a shooting star, which is currently touching the resistance level of 1703.00. This means that next week gold could drop:
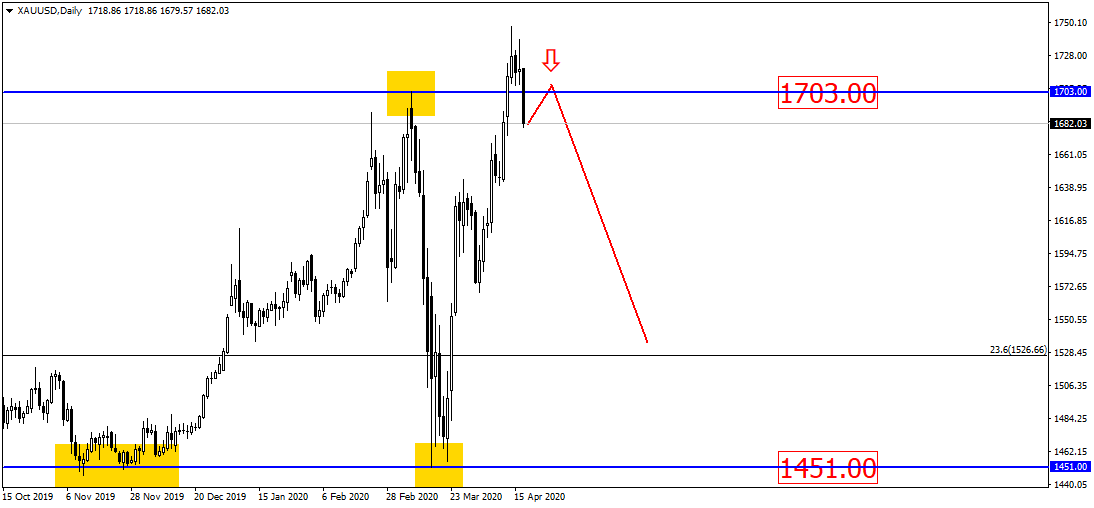
As can be seen from the daily chart, the asset might first target the middle point of the shooting star, that is, the level of 1703.00, and then potentially drop:
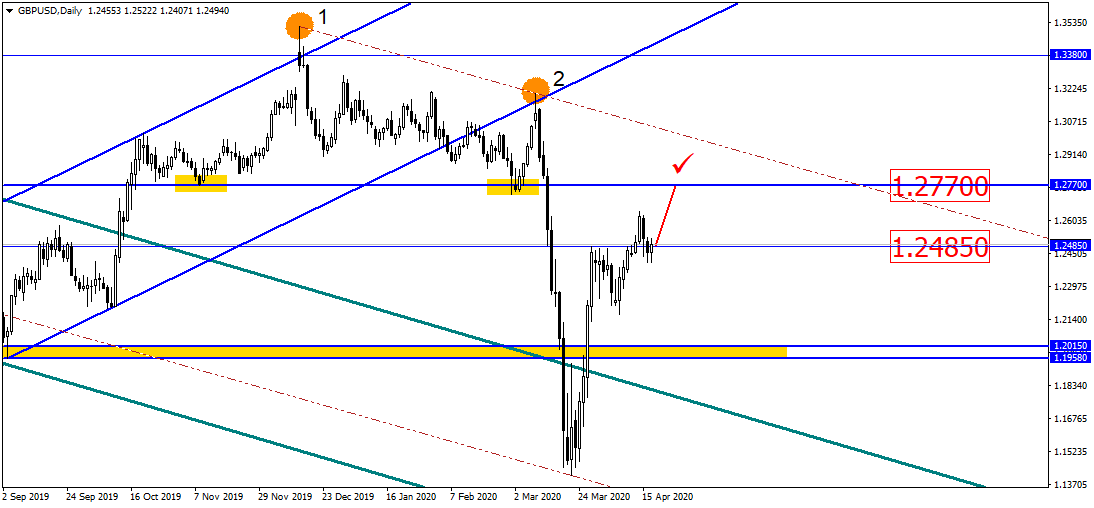
The price of British pound remains at the level of 1.2485, forming a slightly bullish engulfing pattern that can make the prices jump till the 1.2770 level:
Let us remind you that this material is provided for informative purposes only and cannot be considered as a direct go ahead to implement transactions in the financial markets. Trading in the financial markets is very risky.
Disclaimer: The material provided is for information purposes only and should not be considered as investment advice. The views, information, or opinions expressed in the text belong solely to the author, and not to the author’s employer, organization, committee or other group or individual or company.
Past performance is not indicative of future results.
High Risk Warning: CFDs are complex instruments and come with a high risk of losing money rapidly due to leverage. 69% and 73% of retail investor accounts lose money when trading CFDs with Tickmill UK Ltd and Tickmill Europe Ltd respectively. You should consider whether you understand how CFDs work and whether you can afford to take the high risk of losing your money.
Futures and Options: Trading futures and options on margin carries a high degree of risk and may result in losses exceeding your initial investment. These products are not suitable for all investors. Ensure you fully understand the risks and take appropriate care to manage your risk.