Is the EUR/USD Heading Down? Is Gold Trying to Jump?
Good day!
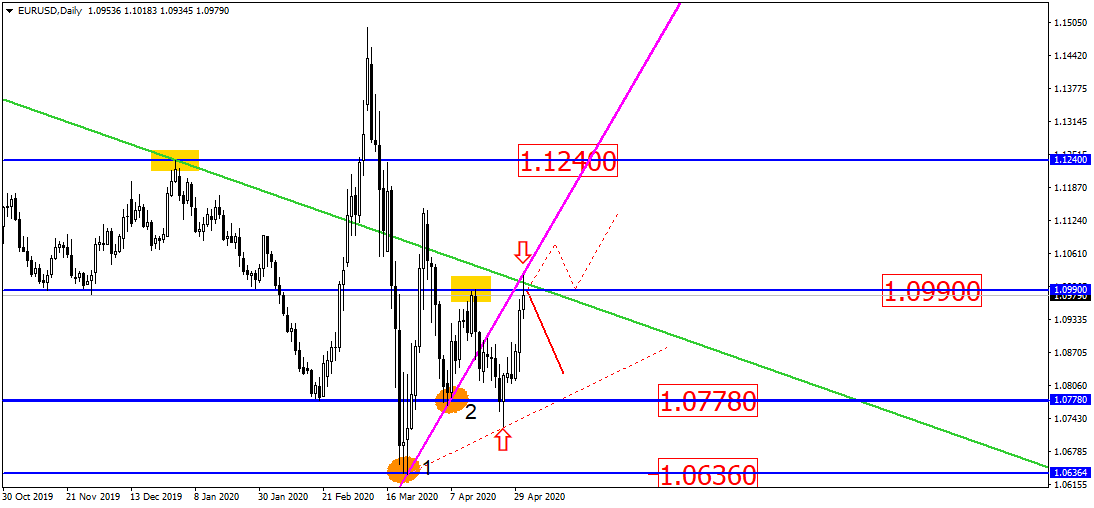
The EUR/USD is currently touching 1.0990, a local resistance level. The asset is also approaching a zone where the broken uptrend formed between 1.0636 and 1.0768 and the weekly downtrend (or the green line) between the points 1.2556 and 1.1239. The currency pair could slightly correct itself and head down with a bullish sentiment in mind:
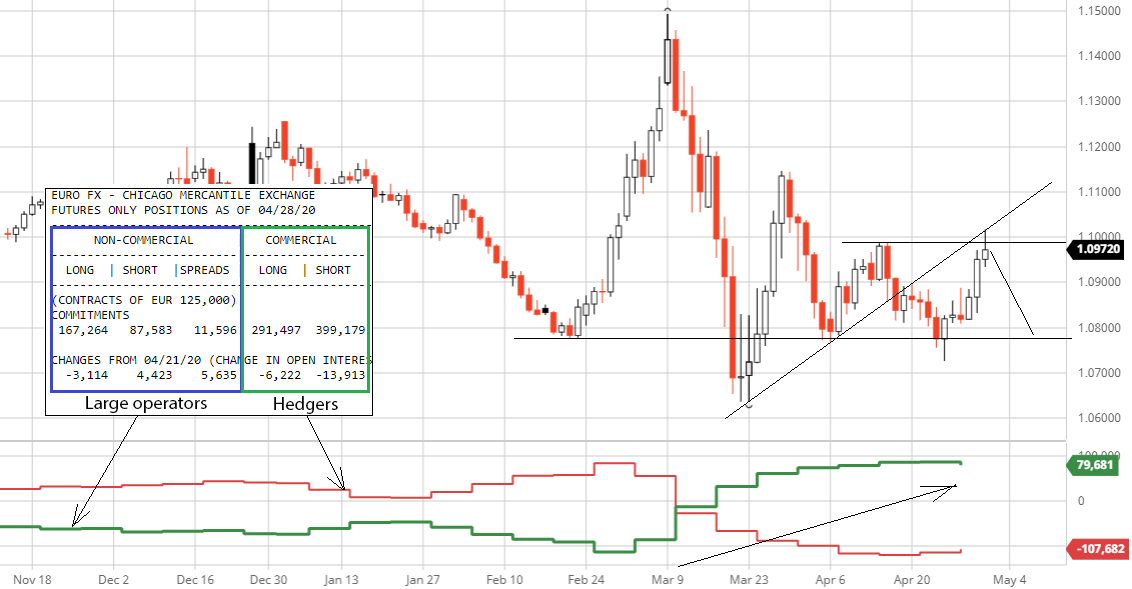
Based on the reports by COT CFTC, the situation remains pretty much the same. Large operators keep favoring the net long position although last time they were expanding sales and shortening purchases. The correction could potentially happen inside the general trend:
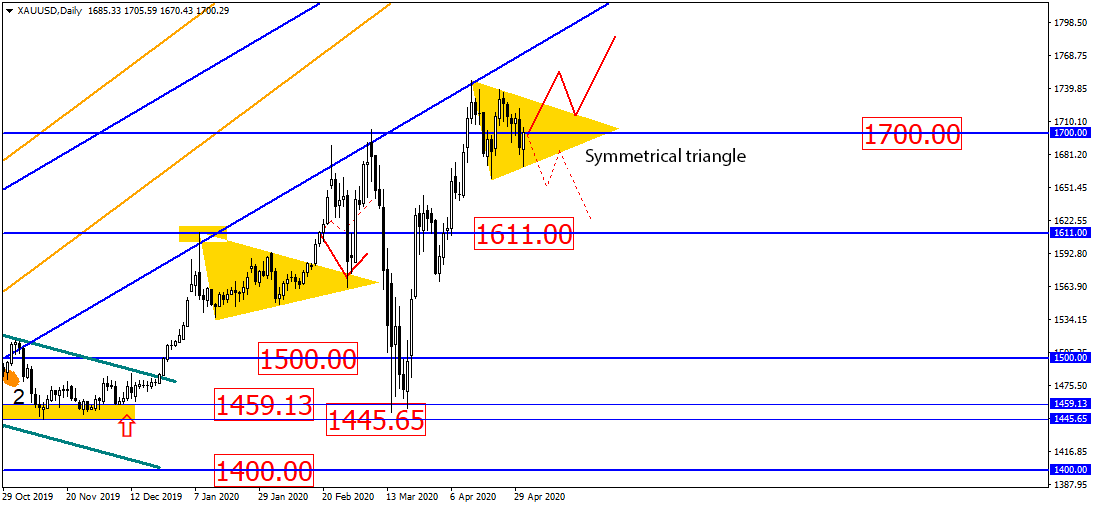
In the daily chart, the price of gold is forming a triangle, which can either continue or reverse the current trend. With the ascending nature of the asset in mind, this triangle is rather bullish, possibly indicating the asset’s likelihood of breaking the upper side of triangle and heading up. The asset might also break this triangle down so we’ll have to wait and see what will happen next:
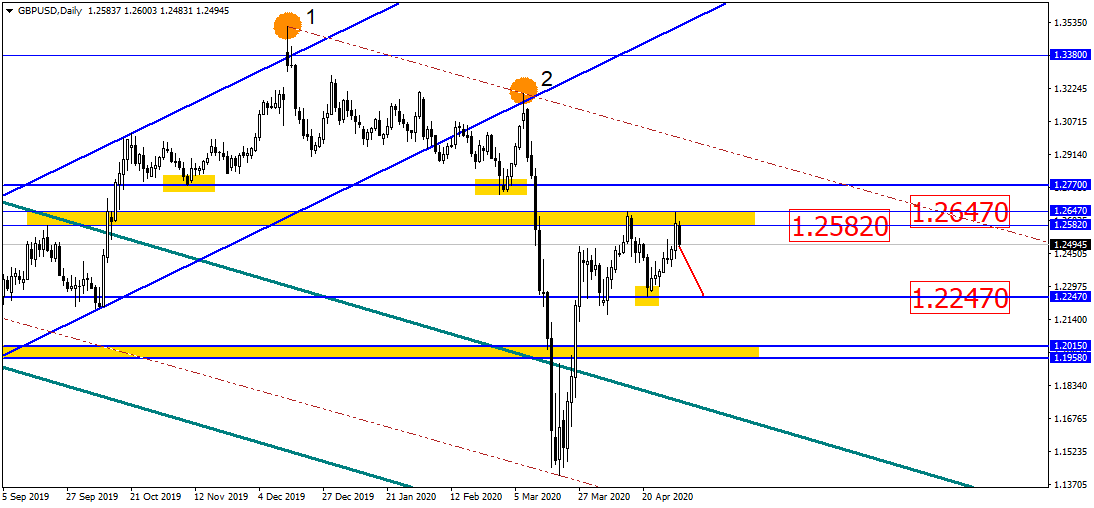
The British pound has pulled from the resistance zone between the levels 1.2582 and 1.2647, forming a bearish engulfing pattern at the same time. So far, the currency pair appears to be likely to drop and gain support at the 1.2247 level:
Let us remind you that this material is provided for informative purposes only and cannot be considered as a direct go ahead to implement transactions in the financial markets. Trading in the financial markets is very risky.
Disclaimer: The material provided is for information purposes only and should not be considered as investment advice. The views, information, or opinions expressed in the text belong solely to the author, and not to the author’s employer, organization, committee or other group or individual or company.
Past performance is not indicative of future results.
High Risk Warning: CFDs are complex instruments and come with a high risk of losing money rapidly due to leverage. 69% and 73% of retail investor accounts lose money when trading CFDs with Tickmill UK Ltd and Tickmill Europe Ltd respectively. You should consider whether you understand how CFDs work and whether you can afford to take the high risk of losing your money.
Futures and Options: Trading futures and options on margin carries a high degree of risk and may result in losses exceeding your initial investment. These products are not suitable for all investors. Ensure you fully understand the risks and take appropriate care to manage your risk.