Oil Prices Drop Amid Iran Attack
Good day!
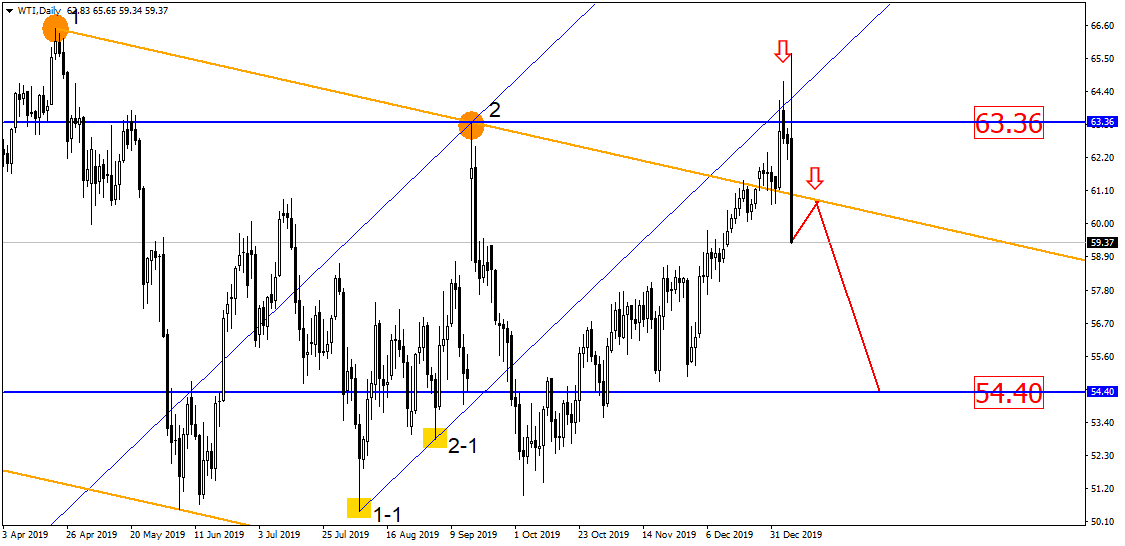
Oil prices jumped on Wednesday and are now going down amid the recent Iran attack. In principle, the asset’s prices pulled from the broken uptrend and returned to the downtrend that got broken earlier. Should the trading day close with a current long black candle and this is most likely to happen, oil prices may drop even further, all the way till the level of 54.40:
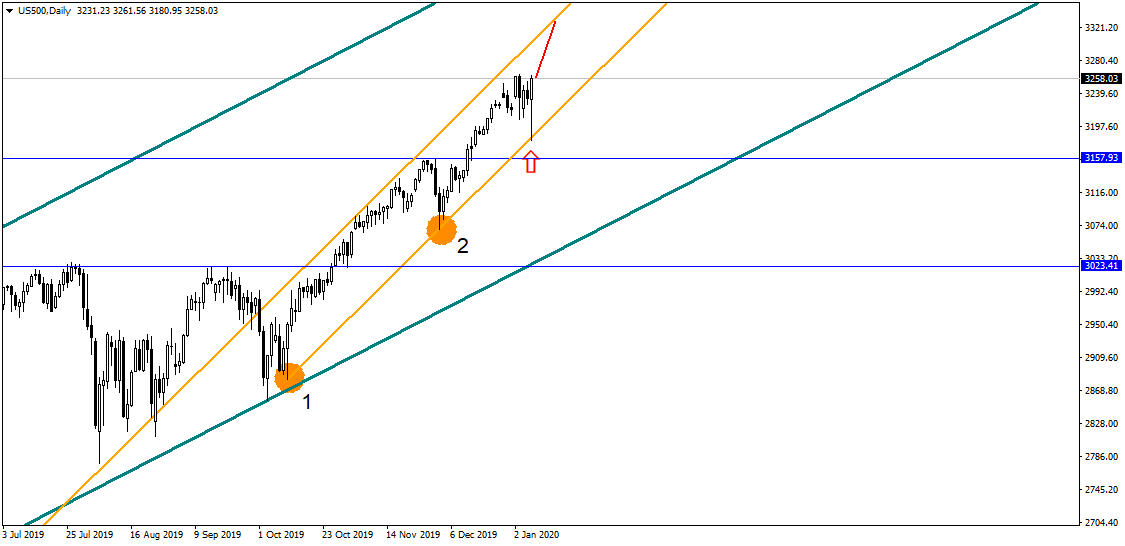
The price of American stock index S&P500 pulled from the uptrend trying to close the trading day with a bullish engulfing. This asset will most likely jump anytime soon. So, the index might even hit new historical maximums. Let’s wait and see what happens next:
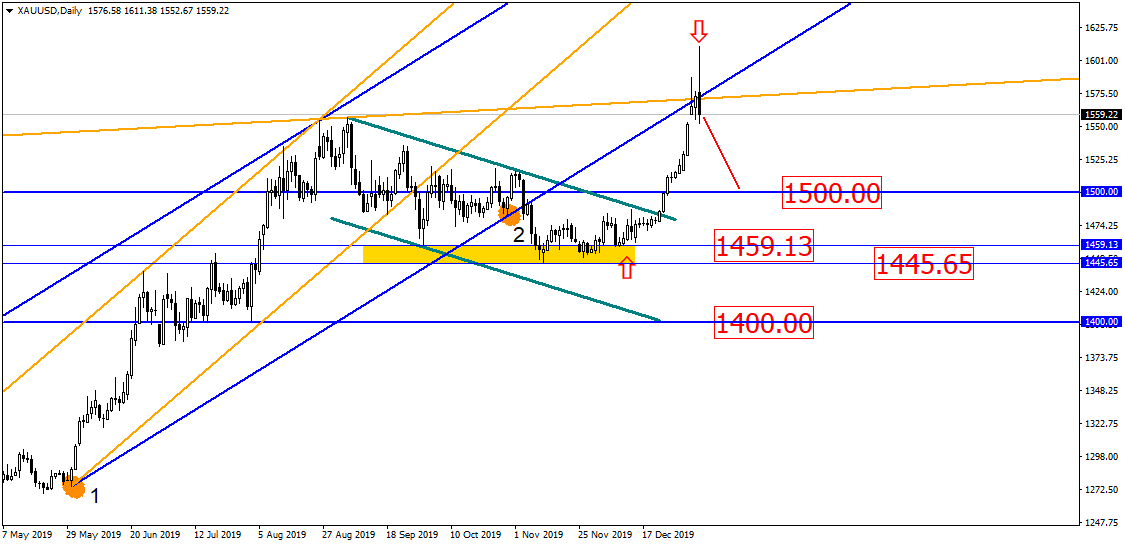
In the daily chart, gold has pulled from the broken uptrend and formed the shooting star, which also acts as engulfing. It means that gold might potentially target the psychological level of 1500:
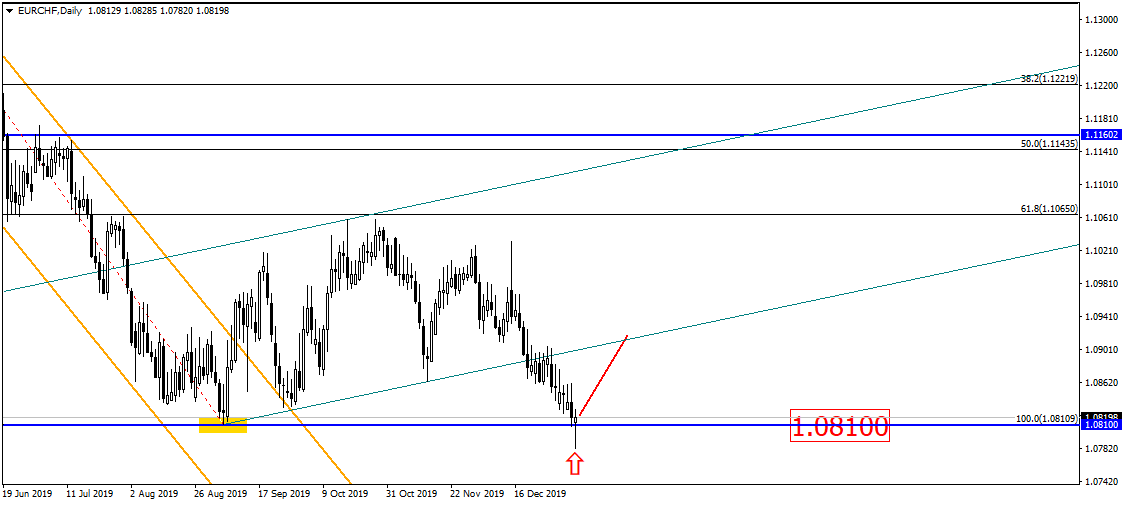
The cross-rate of EUR/CHF touched the horizontal level of 1.0810 with a hammer. It signifies potential reversal. This currency pair will most likely jump:
Disclaimer: The material provided is for information purposes only and should not be considered as investment advice. The views, information, or opinions expressed in the text belong solely to the author, and not to the author’s employer, organization, committee or other group or individual or company.
High Risk Warning: CFDs are complex instruments and come with a high risk of losing money rapidly due to leverage. 73% and 70% of retail investor accounts lose money when trading CFDs with Tickmill UK Ltd and Tickmill Europe Ltd respectively. You should consider whether you understand how CFDs work and whether you can afford to take the high risk of losing your money.
Disclaimer: The material provided is for information purposes only and should not be considered as investment advice. The views, information, or opinions expressed in the text belong solely to the author, and not to the author’s employer, organization, committee or other group or individual or company.
Past performance is not indicative of future results.
High Risk Warning: CFDs are complex instruments and come with a high risk of losing money rapidly due to leverage. 69% and 73% of retail investor accounts lose money when trading CFDs with Tickmill UK Ltd and Tickmill Europe Ltd respectively. You should consider whether you understand how CFDs work and whether you can afford to take the high risk of losing your money.
Futures and Options: Trading futures and options on margin carries a high degree of risk and may result in losses exceeding your initial investment. These products are not suitable for all investors. Ensure you fully understand the risks and take appropriate care to manage your risk.