Russian Ruble on Downward Trend
Good day!
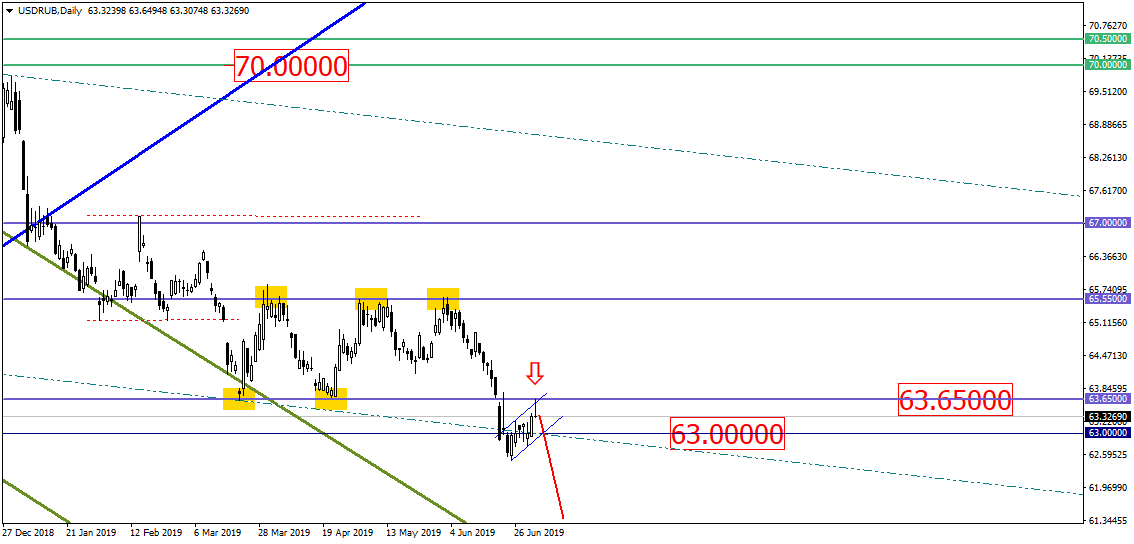
The price of USD/RUB seems be getting a downward slope. Currently, the asset’s price approached the broken lower boundary of the range, that is, the level of 63.65 in the daily chart, forming a shooting star or so-called gravestone doji. The chart also shows the formation of a reverse flag – its handle and body are already there:
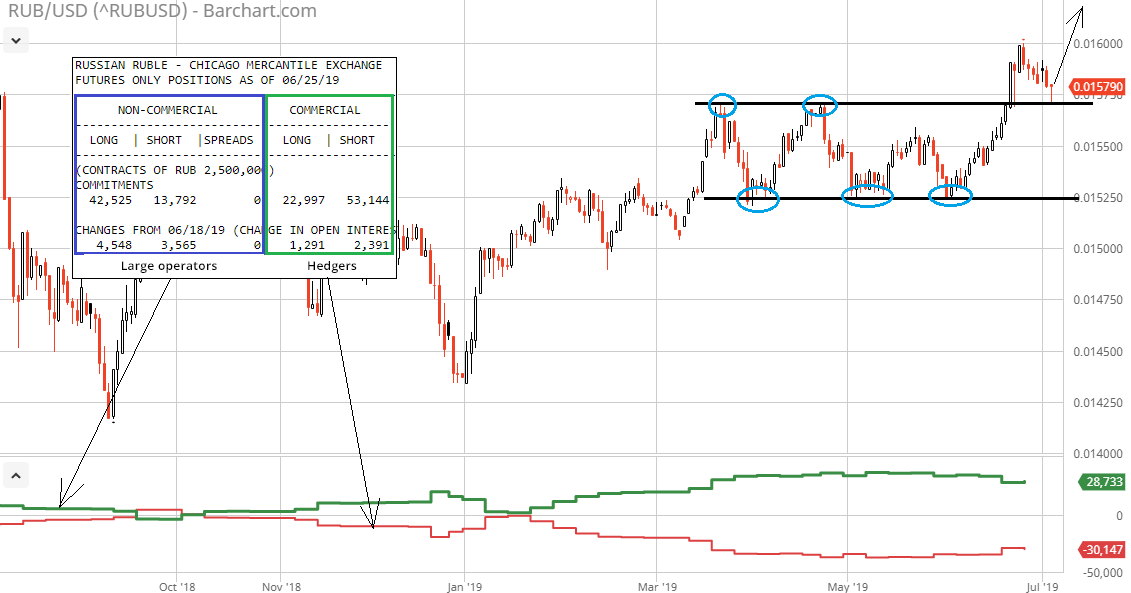
Based on the recent reports provided by COT CFTC, large operators keep expanding long positions and are very successful in that matter:
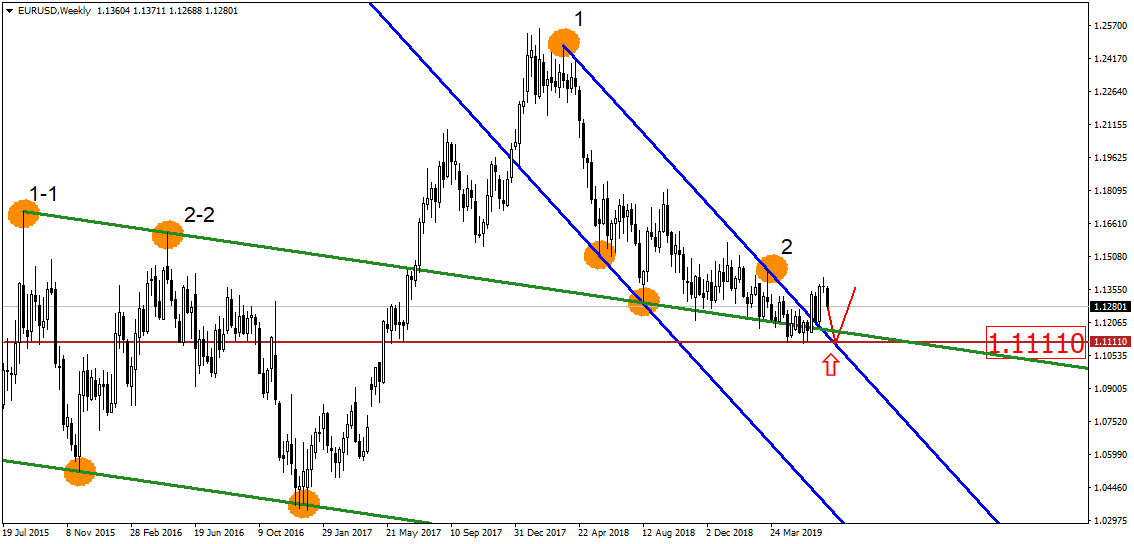
In the weekly chart, the price of single currency is getting back to the crossing point of two broken downtrends and horizontal level of 1.1111:
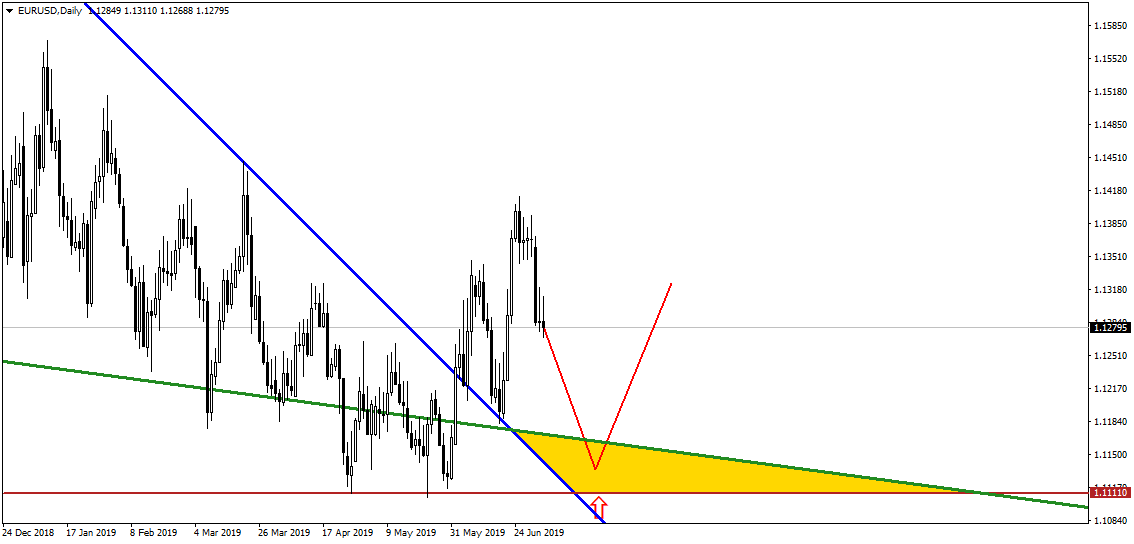
In the daily chart, crossing area of broken trends and the level are denoted by yellow color. Away from this area the asset can potentially pull back up:
Let us remind you that this material is provided for informative purposes only and cannot be considered as a direct go ahead to implement transactions in the financial markets. Trading in the financial markets is very risky.
Disclaimer: The material provided is for information purposes only and should not be considered as investment advice. The views, information, or opinions expressed in the text belong solely to the author, and not to the author’s employer, organization, committee or other group or individual or company.
Past performance is not indicative of future results.
High Risk Warning: CFDs are complex instruments and come with a high risk of losing money rapidly due to leverage. 69% and 73% of retail investor accounts lose money when trading CFDs with Tickmill UK Ltd and Tickmill Europe Ltd respectively. You should consider whether you understand how CFDs work and whether you can afford to take the high risk of losing your money.
Futures and Options: Trading futures and options on margin carries a high degree of risk and may result in losses exceeding your initial investment. These products are not suitable for all investors. Ensure you fully understand the risks and take appropriate care to manage your risk.