Russian Ruble Remains Flat: What’s Next?
Good day!
Russian ruble remains flat right next to the 65 level. So far, the levels of market interest are 67.00 and 63.70. A kind of trading range has formed for now, and the asset could pull back away from it:
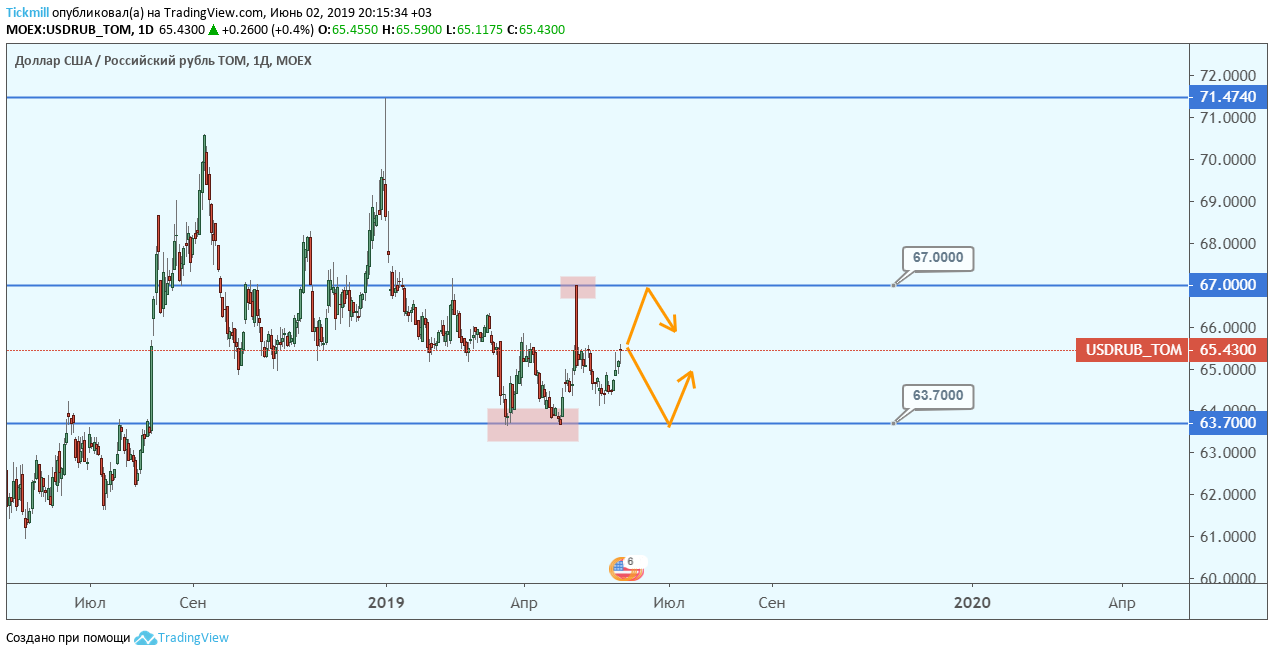
Доллар США / Российский рубль – US Dollar / Russian ruble
Based on the latest reports by COT CFTC, large operators keep expanding their short positions on the Russian ruble, and heavily buying the assets at the same time. So, based on the size of large operators net long position, it’s either a correction about to happen or trend shall reverse and weaken the Ruble. We assume that the last option is quite attractive and more likely given the current state of the market and trade war. There is the potential that this is the only beginning with plenty more things to come:
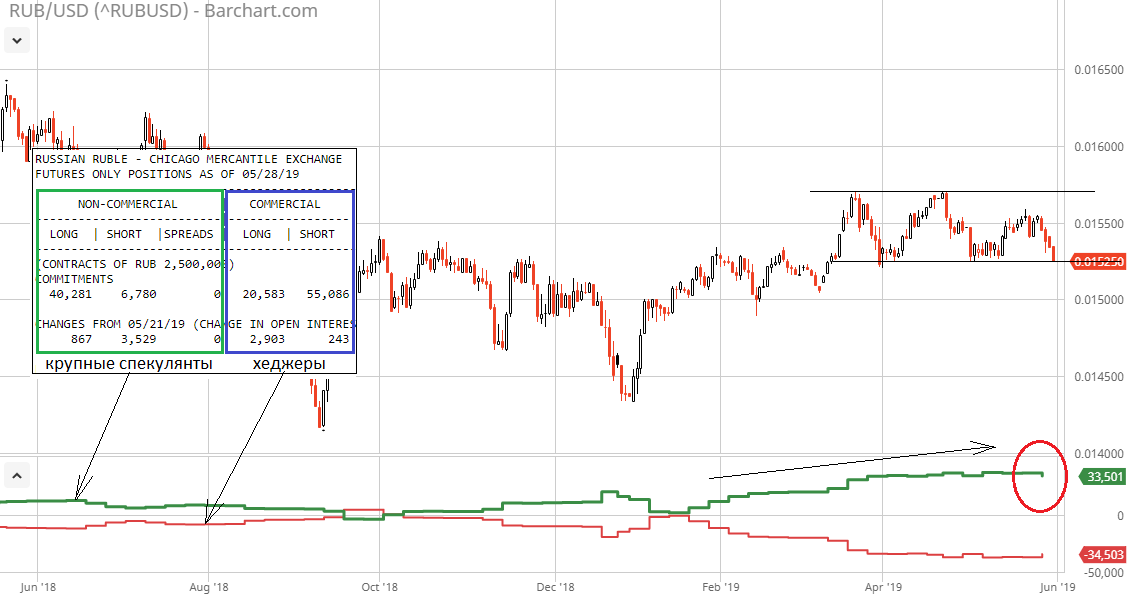
Крупные спекулянты – Large operators
Хеджеры - Hedgers
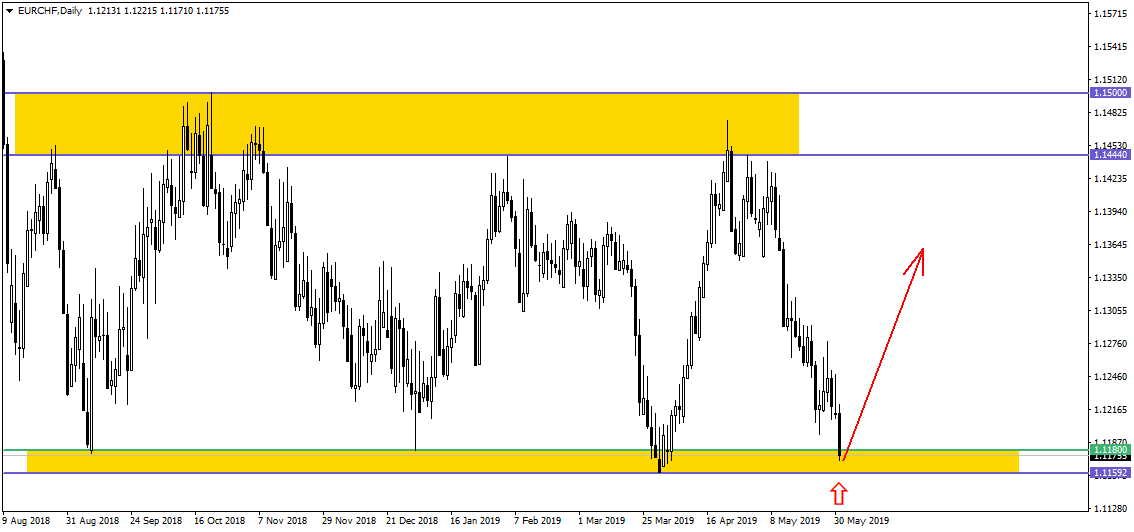
The cross rate of EUR/CHF pulled back from the upper boundary of daily range and reached its lower boundary again. We assume that now, the asset’s price should pull back up, right inside the flat. Here we should consider the candlestick formations, which will shine more light onto the situation. The flat could remain long but not forever. Also, at some point, the current trading range will quickly get broken down. It’s also important to remember that the Swiss Central Bank really wants the EUR/CHF rate as high as possible:
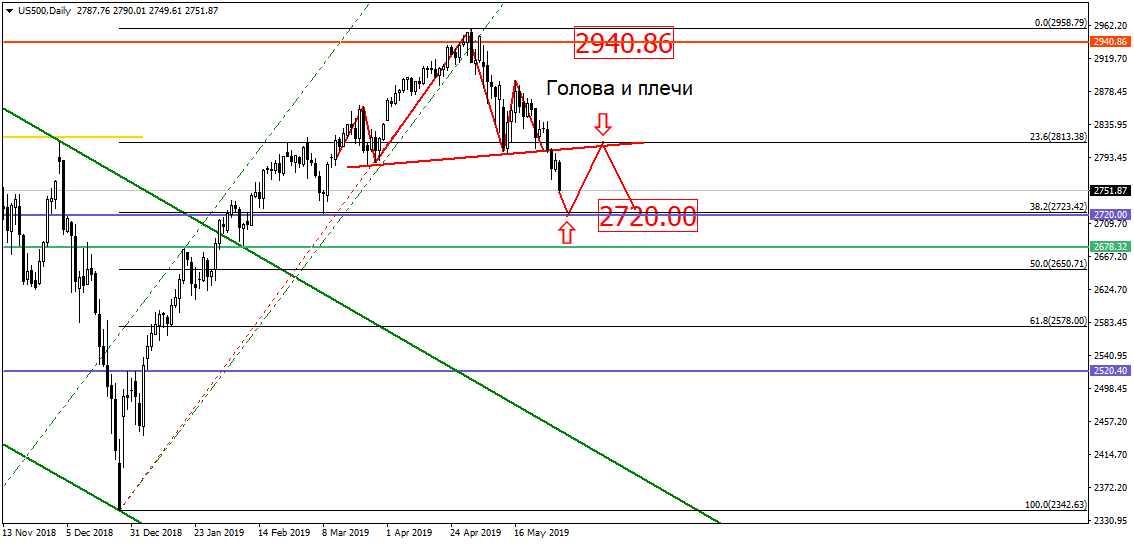
American stock index S&P500 could still potentially pull back from the 2720 level. Although there is currently an inverse head and shoulders pattern with an unusually high left shoulder visible on the chart (usually shoulders are half the size of height of a head). Therefore, the asset’s price may resume the drop from the neckline:
Please note that this material is provided for informational purposes only and should not be considered as investment advice. Trading in the financial markets is very risky.
Disclaimer: The material provided is for information purposes only and should not be considered as investment advice. The views, information, or opinions expressed in the text belong solely to the author, and not to the author’s employer, organization, committee or other group or individual or company.
Past performance is not indicative of future results.
High Risk Warning: CFDs are complex instruments and come with a high risk of losing money rapidly due to leverage. 69% and 73% of retail investor accounts lose money when trading CFDs with Tickmill UK Ltd and Tickmill Europe Ltd respectively. You should consider whether you understand how CFDs work and whether you can afford to take the high risk of losing your money.
Futures and Options: Trading futures and options on margin carries a high degree of risk and may result in losses exceeding your initial investment. These products are not suitable for all investors. Ensure you fully understand the risks and take appropriate care to manage your risk.