S&P 500 E-mini Futures ( ES1! ), H4 Potential for Bullish rise
Type:
Bullish Rise
Key Levels:
Resistance:
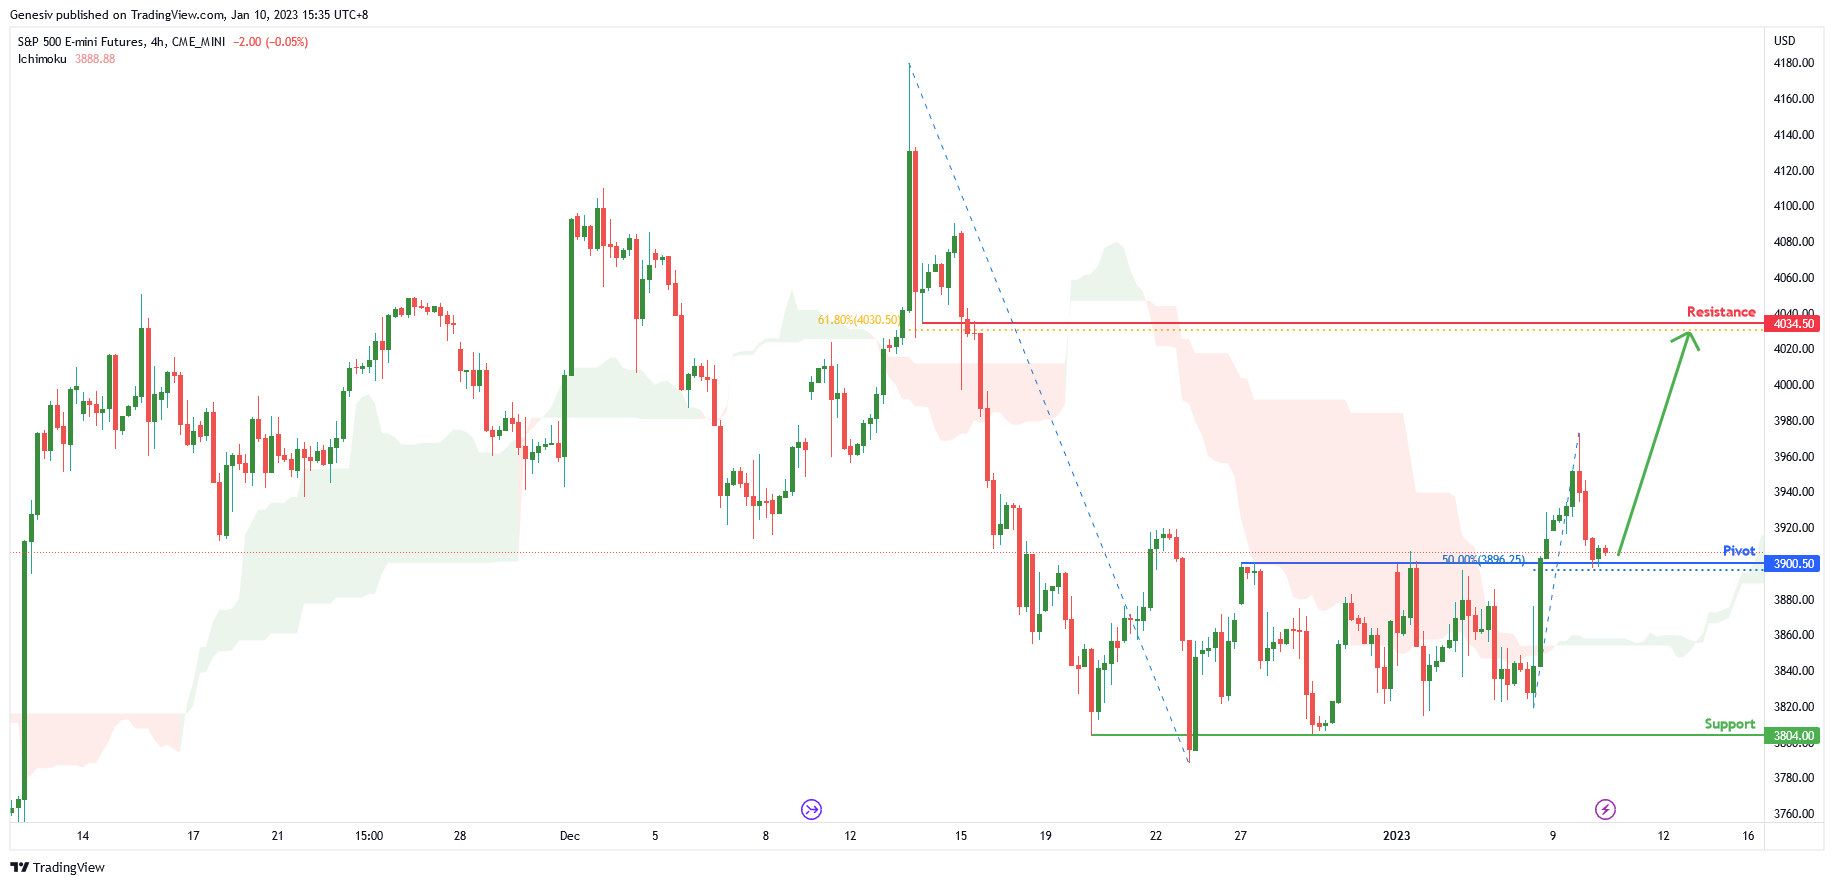
4034.50
Pivot:
3900.50
Support:
3804.00
Preferred Case:
Looking at the H4 chart, my overall bias for SPX is bullish due to the current price being above the Ichimoku cloud , indicating a bullish market. If this bullish momentum continues, expect price to continue heading towards the resistance at 4034.50, where the 61.8% Fibonacci line is.
Alternative Scenario:
Price could break the pivot at 3900.50, where the 50% Fibonacci line is before heading towards the support at 3804.00, where the previous low is.
Fundamentals:
There are no major news.

Disclaimer: The material provided is for information purposes only and should not be considered as investment advice. The views, information, or opinions expressed in the text belong solely to the author, and not to the author’s employer, organization, committee or other group or individual or company.
Past performance is not indicative of future results.
High Risk Warning: CFDs are complex instruments and come with a high risk of losing money rapidly due to leverage. 69% and 73% of retail investor accounts lose money when trading CFDs with Tickmill UK Ltd and Tickmill Europe Ltd respectively. You should consider whether you understand how CFDs work and whether you can afford to take the high risk of losing your money.
Futures and Options: Trading futures and options on margin carries a high degree of risk and may result in losses exceeding your initial investment. These products are not suitable for all investors. Ensure you fully understand the risks and take appropriate care to manage your risk.
Desmond Leong runs an award-winning research firm (The Technical Analyst finalists 2018/19/20 for Best FX and Equity Research) advising banks, brokers and hedge funds. Backed by a team of CFA, CMT, CFTe accredited traders, he takes on the market daily using a combination of technical and fundamental analysis.