S&P500 Daily Action Areas & Price Targets 29/9/26

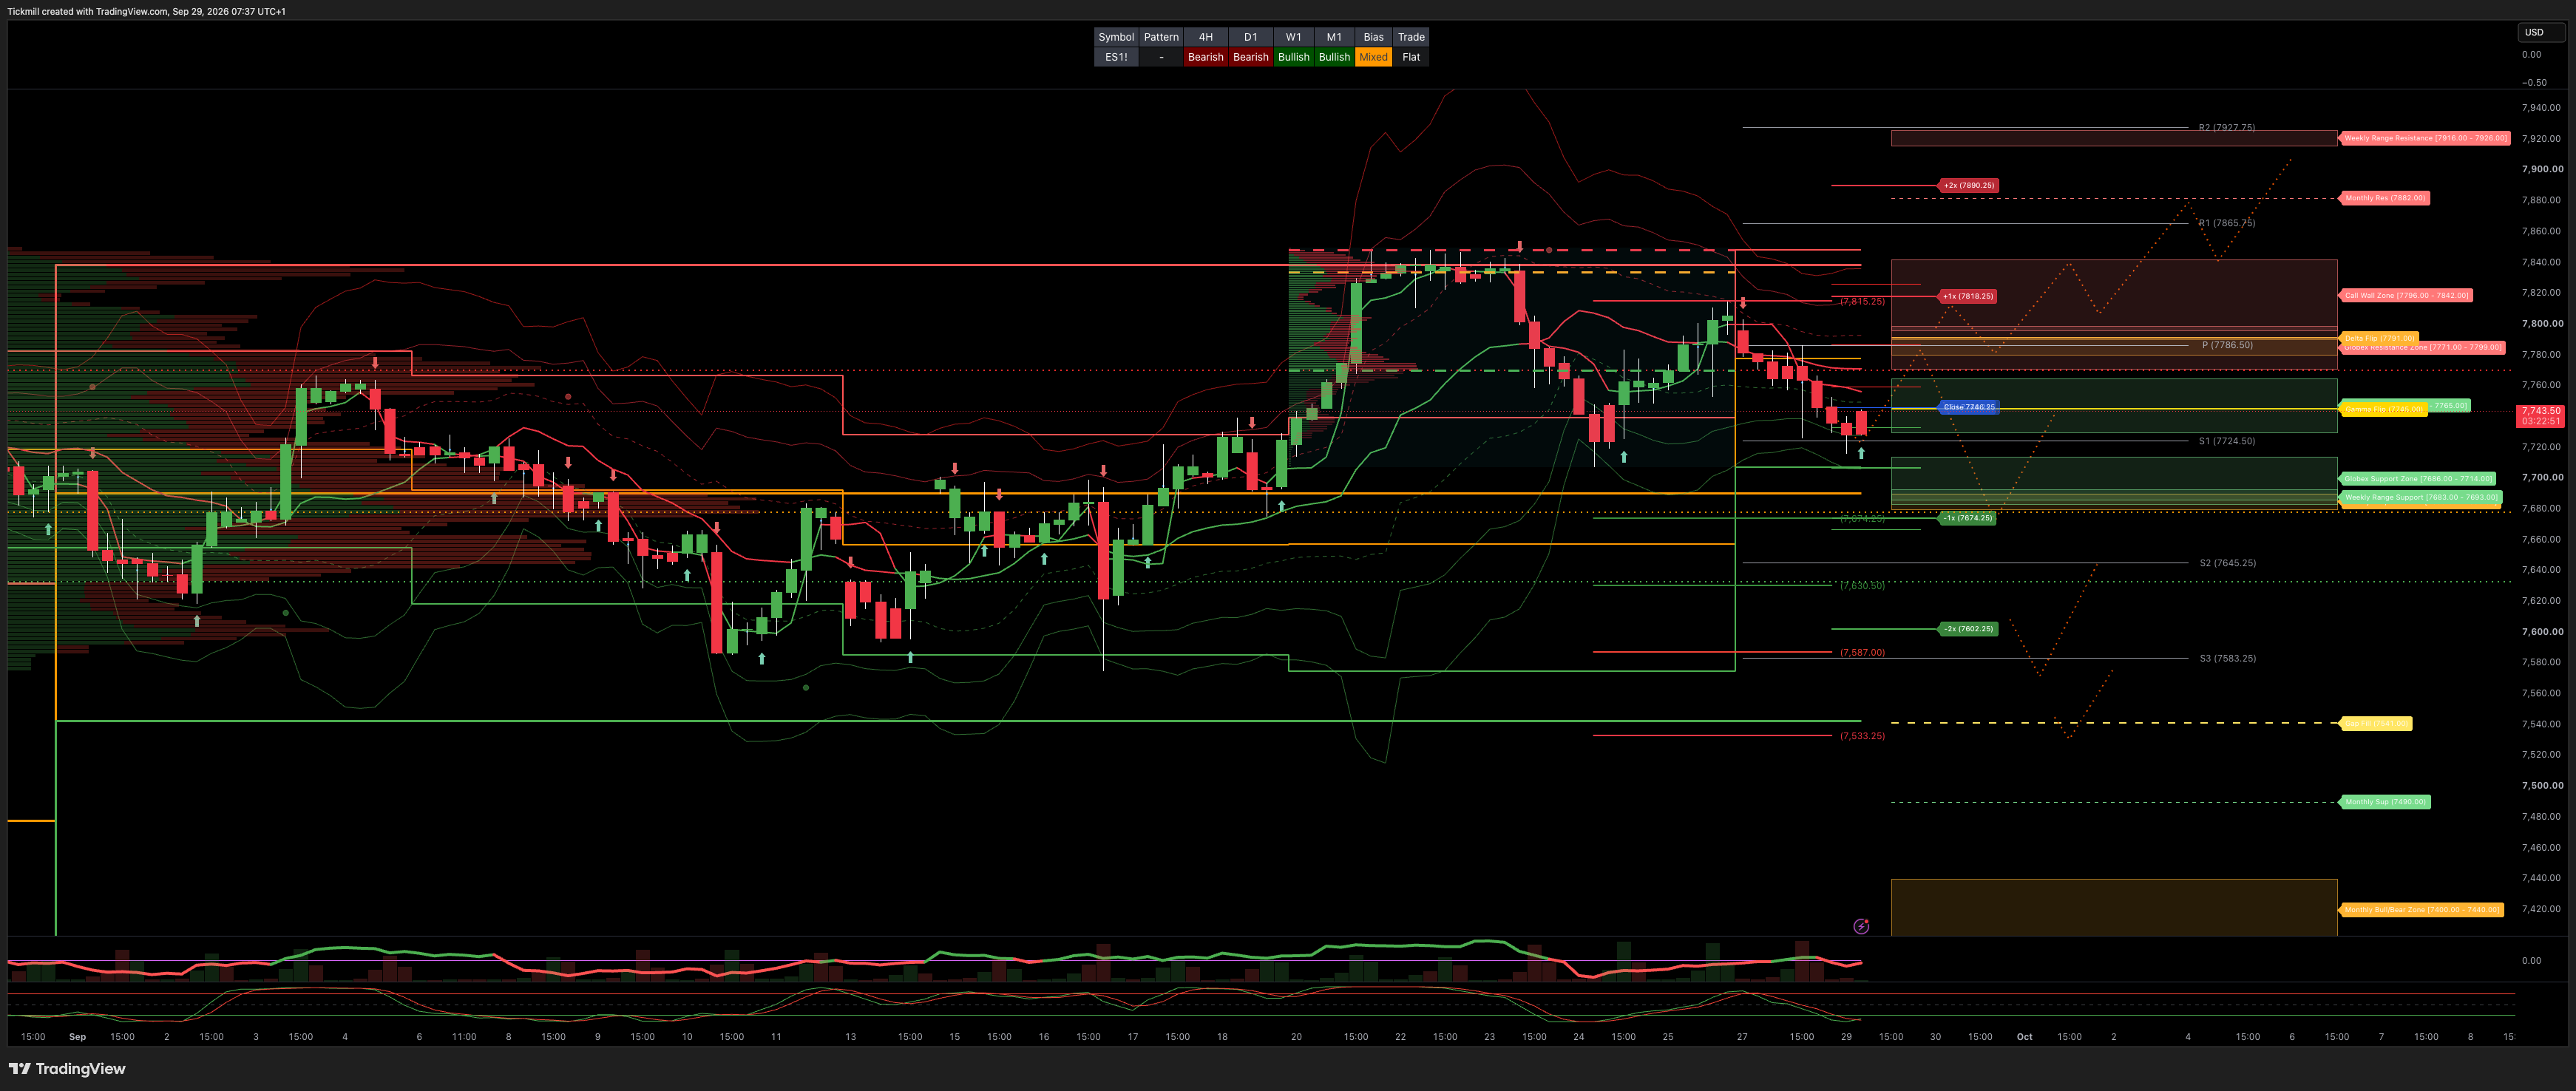
S&P500 Daily Action Areas & Price Targets 29/9/26
***QUOTING ES1!(Z CONTRACT LEVLES) FOR CASH US500 EQUIVALENT LEVELS, SUBTRACT POINT DIFFERENCE***
MONTHLY-WEEKLY& DAILY LEVELS
MONTHLY BULL BEAR ZONE 7440/7400
MONTHLY RANGE RES 7882 SUP 7490
WEEKLY BULL BEAR ZONE 7690/80
WEEKLY RANGE RES 7926/16 SUP 7683/93
DAILY BULL BEAR ZONE 7770/60
GLOBEX RANGE RES 7771/99 SUP 7714/7686
GAMMA FLIP 7745
DELTA FLIP 7791
CALL WALLS 7796/7842
PUT WALLS 7730/7765
UNFILLED GAPS 7541
DAILY STRUCTURE - BALANCE 7848 - 7725
WEEKLY STRUCTURE - BALANCE 7848 - 7575
MONTHLY STRUCTURE - OTFH - 7542
VIX BULL BEAR ZONE 17.7
VVIX / VIX 5.66 places the market in a balanced, transitionary regime. It sits right in the historical "sweet spot" for options performance, indicating that while absolute equity fear is modest, tail-risk hedging is subtly starting to pick up
PRIMARY TRADES & TARGETS
SHORT ON REJECT/RECLAIM DBBZ TARGET DAILY RANGE SUP
***ADDITIONAL SETUPS & TARGETS HIGHLIGHTED ON THE CHARTS***
(I FADE TESTS OF 2 SIGMA LEVELS ESPECIALLY INTO THE FINAL HOUR OF THE NY CASH SESSION AS 90% OF THE TIME WHEN TESTED THE MARKET WILL CLOSE ABOVE OR BELOW THESE LEVELS)
SPX PUT/CALL RATIO 1.06 (The numbers reflect options traded during the current session.) A put-call ratio below 0.7 is generally considered bullish, and a put-call ratio above 1.0 is generally considered bearish.
JHEQX Q3 Collar Short Call Cap: ~7,750 – 7,900 - Long Put Strike: ~7,050 – 7,100 (approx. 5% downside protection) Short Put Strike: ~5,950
DEC2025 OPEX to DEC2026 OPEX is 945 points giving us a range of [5889,7779]
Notes On Structure Implications
Balance: This refers to a market condition where prices move within a defined range, reflecting uncertainty as participants await further market-generated information. Our approach to balance includes favouring fade trades at the range extremes (highs/lows) while preparing for potential breakout scenarios if the balance shifts.
One-Time Framing Higher (OTFH): This represents a market trend where each successive bar forms a higher low, signalling a strong and consistent upward movement.
One-Time Framing Lower (OTFL): This describes a market trend where each successive bar forms a lower high, indicating a pronounced and steady downward movement.
GOLDMAN SACHS FICC & EQUITY TRADING DESK VIEWS
US equity benchmarks closed lower across the board as markets navigated conflicting geopolitical headlines regarding US-Iran negotiations and surging Treasury yields. The US 10-Year yield hit 5.2277% (+6.7 bps), extending one of the sharpest 1-month moves in real rates since 2013 and crossing critical technical thresholds that historically trigger negative forward equity returns.
Tech and AI heavyweights faced additional pressure following reports that OpenAI paused advanced model training due to security breach incidents, combined with Elon Musk raising privacy concerns over Meta's Muse agent. Breadth remained exceptionally fragile, with 334 S&P 500 constituents closing in the red and the median index stock trading 16% below its 52-week high (lowest breadth levels since the Dot-Com Bubble).
MARKET SUMMARY & ASSET BREAKDOWN
S&P 500 (SPX): Closed at 7,683.00 (-0.77%) | MOC $400M to BUY | VIX up +8.07% to 16.07 | Remaining weekly straddle priced at 1.16%
Nasdaq-100 (NDX): Closed at 30,276.00 (-1.08%) | Underperformed on AI security concerns and software executive migration
Russell 2000 (RUT): Closed at 2,817.00 (-0.69%) | Outperformed NDX/SPX on a relative basis despite rate pressure
Dow Jones (DJI): Closed at 51,481.00 (-0.67%) | Broad drag across industrial and mega-cap components
US 10-Year Treasury: Yield at 5.2277% (+6.7 bps) | Fresh cycle highs; 1-month real rate move at worst levels since 2013
WTI Crude: Price at $93.09 (+0.71%) | Rebounded as Iranian officials rebutted US sanction-relief headlines
Gold: Price at $4,120.00 (-3.83%) | Heavy sell-off under pressure from surging 5.2%+ real yields and a firmer USD (DXY 101.20)
Bitcoin: Price at $83,505.00 (-1.21%) | Weakness tracked tech index de-risking
CBOE VIX: Closed at 16.07 (+8.07%) | SPX/NDX skew bid into the decline; shorter-dated NDX vols compressed -0.3v
SINGLE-STOCK & TECH DISRUPTIONS
MongoDB (MDB -18.5%): Weighted heavily on the software sector after announcing its CEO will step down to take a new executive role at Meta.
Nvidia (NVDA): Outperformed broader tech after announcing a $150B buyback expansion and launching its Open Agent Safety Platform to address AI agent security protocols.
OpenAI & Meta: OpenAI paused advanced model training again due to breach incidents, while privacy scrutiny mounted around Meta Muse ahead of tomorrow's OpenAI Dev Day and Micron (MU) earnings on Wednesday.
INSTITUTIONAL FLOWS & DERIVATIVES COLOR
Desk Activity (-781 bps to SALE / 3/10 Rating):
Asset Managers (LOs): Massive net sellers of -$1.3B (supply in Communication Services, Industrials, Tech, Discretionary, and macro products vs. minor demand in Energy).
Hedge Funds: Net sellers of -$1.7B (supply in Tech, macro products, Discretionary, and Communication Services).
Derivatives & Volatility Dynamics:
Hedge Rolls: Institutional accounts were active rolling SPY and QQQ December hedges up and out to March 2027.
IWM Hedge Setup & CTA Estimates: Desk highlights IWM hedges as highly attractive. GS systematic CTA models project -$5.3B of RTY futures selling over the next week in a flat tape (one of the largest 1-week sell estimates in 6 years).
Dealer Gamma Positioning: Dealers remain in a long SPX gamma pocket, maintaining length in both directions. In NDX, dealers are currently long gamma but flip short on dramatic upside moves (+4%).
Disclaimer: The material provided is for information purposes only and should not be considered as investment advice. The views, information, or opinions expressed in the text belong solely to the author, and not to the author’s employer, organization, committee or other group or individual or company.
Past performance is not indicative of future results.
High Risk Warning: CFDs are complex instruments and come with a high risk of losing money rapidly due to leverage. 69% and 73% of retail investor accounts lose money when trading CFDs with Tickmill UK Ltd and Tickmill Europe Ltd respectively. You should consider whether you understand how CFDs work and whether you can afford to take the high risk of losing your money.
Futures and Options: Trading futures and options on margin carries a high degree of risk and may result in losses exceeding your initial investment. These products are not suitable for all investors. Ensure you fully understand the risks and take appropriate care to manage your risk.
Patrick has been involved in the financial markets for well over a decade as a self-educated professional trader and money manager. Flitting between the roles of market commentator, analyst and mentor, Patrick has improved the technical skills and psychological stance of literally hundreds of traders – coaching them to become savvy market operators!