S&P500 LDN Open Trading Update 26/5/26

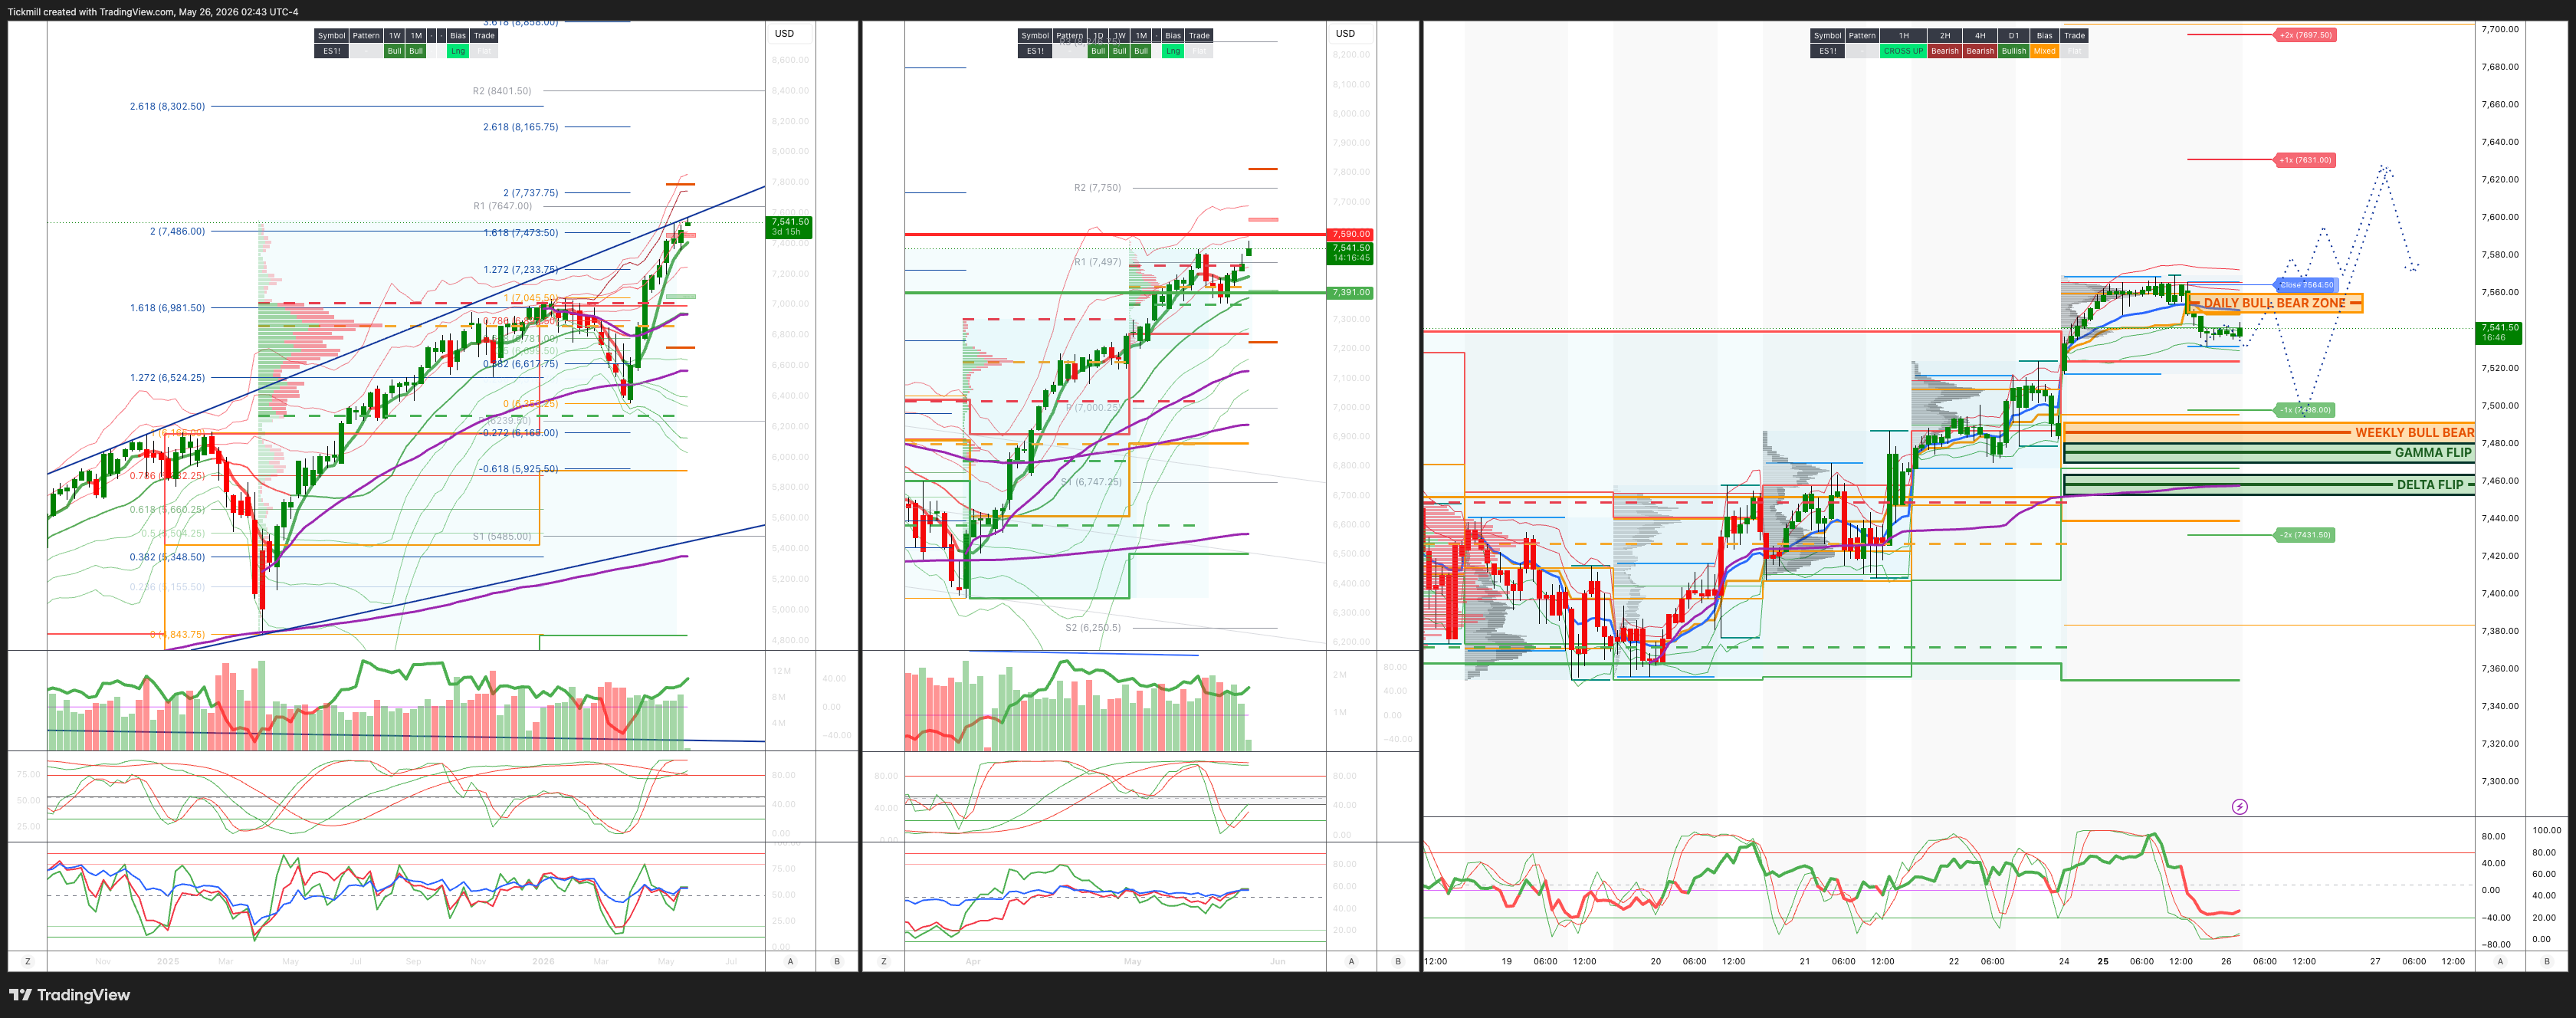
S&P500 LDN Open Trading Update 26/5/26
***QUOTING ES1! FOR CASH US500 EQUIVALENT LEVELS, SUBTRACT POINT DIFFERENCE***
WEEKLY BULL BEAR ZONE 7490/80
WEEKLY RANGE RES 7590 SUP 7391
June MOPEX Straddle: 274pt range implies a OPEX to OPEX range of [7134, 7683]
June QOPEX Straddle is 546.4pt giving us a range of [5960,7052]
JHEQX Q2 Collar 6189/6290 - 6865/6955
DEC2025 OPEX to DEC2026 OPEX is 945 points giving us a range of [5889,7779]
SPX PUT/CALL RATIO 1.16 (The numbers reflect options traded during the current session. A put-call ratio below 0.7 is generally considered bullish, and a put-call ratio above 1.0 is generally considered bearish)
DAILY VWAP BULLISH 7440
WEEKLY VWAP BULLISH 7417
MONTHLY VWAP BULLISH 6898
DAILY STRUCTURE – OTFH - 7478
WEEKLY STRUCTURE – BALANCE - 7540/7354
MONTHLY STRUCTURE - OTFH - 6514
Balance: This refers to a market condition where prices move within a defined range, reflecting uncertainty as participants await further market-generated information. Our approach to balance includes favouring fade trades at the range extremes (highs/lows) while preparing for potential breakout scenarios if the balance shifts.
One-Time Framing Higher (OTFH): This represents a market trend where each successive bar forms a higher low, signalling a strong and consistent upward movement.
One-Time Framing Lower (OTFL): This describes a market trend where each successive bar forms a lower high, indicating a pronounced and steady downward movement.
DAILY BULL BEAR ZONE 7550/60
GAMMA FLIP 7475
DELTA FLIP 7459
DAILY RANGE RES 7533 SUP 7408
2 SIGMA RES 7600 SUP 7334
VIX BULL BEAR ZONE 19
TRADES & TARGETS
SHORT ON REJECT/RECLAIM DAILY BULL BEAR ZONE TARGET WEEKLY BULL BEAR ZONE
LONG ON ACCEPTANCE ABOVE DAILY BULL BEAR ZONE TARGET WEEKLK RANGE RES
***ADDITIONAL SETUPS & TARGETS HIGHLIGHTED ON THE CHARTS***
(I FADE TESTS OF 2 SIGMA LEVELS ESPECIALLY INTO THE FINAL HOUR OF THE NY CASH SESSION AS 90% OF THE TIME WHEN TESTED THE MARKET WILL CLOSE ABOVE OR BELOW THESE LEVELS)
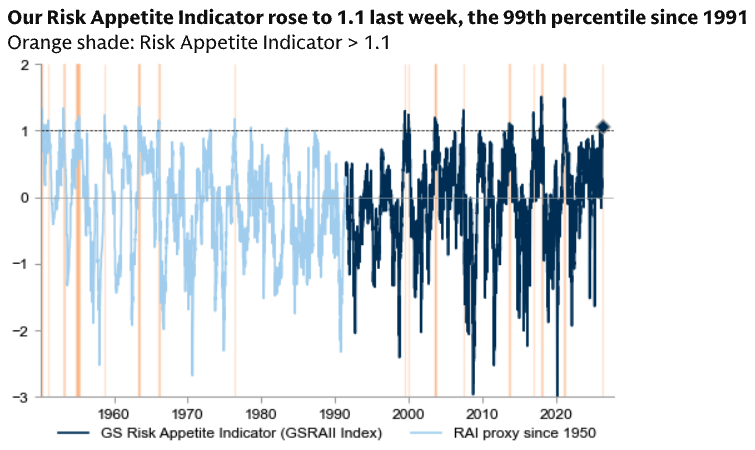
GOLDMAN SACHS TRADING DESK VIEW - ‘RAI 99% 1991 Levels’
Positioning Update: High Risk Appetite, Crowded Momentum, and a Big US Underweight
The positioning backdrop is unusual. Goldman’s Risk Appetite Indicator rose to 1.1, putting it in the 99th percentile since 1991. Historically, this type of high-RAI environment has not necessarily been followed by major downside, but it has usually been associated with low probability of both large rallies and large sell-offs. That matters because it suggests a market where beta may be less rewarding and alpha opportunities become more important.
At the same time, hedge funds are still cautious on US equities, using macro products to hedge exposure. Short exposure in US macro products is now at a 10-year high, while hedge-fund allocations to Asia have increased and their underweight to North America is now the largest on record since the data began in 2016. This creates a strange mix: risk appetite is extremely high at the aggregate market level, but hedge funds are not fully embracing US equity beta. Instead, they are rotating geographically and hedging through index/ETF shorts.
Key takeaways
Goldman’s Risk Appetite Indicator is at 1.1, the 99th percentile since 1991.
High RAI has usually been followed by low risk of large rallies and sell-offs, not necessarily imminent drawdowns.
Hedge funds are selling/shorting US equities through macro products.
US macro-product short exposure is at a 10-year high.
Hedge-fund net allocations are rising toward Asia.
Hedge-fund underweight to the US/North America is the largest on record since 2016.
Equity hedge funds are up around 7% YTD.
Only around 30% of large-cap fundamental mutual funds are beating benchmarks.
Hedge funds and mutual funds are both overweight Healthcare, Industrials, and Materials.
Both hedge funds and mutual funds rotated from Software into Semis during Q1.
Momentum is up around 30% YTD, but positioning looks stretched.
Mutual-fund tilt in Semis versus Software ex-mega caps is the largest since 2012.
Mutual funds are 723bp underweight Mag 7.
There is growing focus on the potential SpaceX IPO, with historical precedent that mutual funds raise cash ahead of very large IPOs.
Risk Appetite Indicator: very high, but not necessarily bearish
The RAI rising to the 99th percentile is a clear sign that investor sentiment and positioning are stretched. However, Goldman’s historical framework is nuanced.
Low RAI tends to create more positive asymmetry because pessimism, low exposure, and cheap risk premia leave more room for upside. High RAI does not automatically mean a crash is coming. Instead, high RAI has historically been followed by a period where the probability of large rallies and large sell-offs is lower.
That implies a more rangebound or grinding tape, where:
broad index upside may be more limited,
downside may also be cushioned,
dispersion can rise,
alpha becomes more valuable,
crowded factors are more vulnerable to reversals,
stock selection matters more than index direction.
In practical terms, this is not a simple “sell everything” signal. It is more of a warning that easy beta may be behind us and crowding should be managed carefully.
Hedge funds: cautious on the US, rotating toward Asia
Hedge funds have continued to sell US equities month-to-date, primarily through macro products. The key point is that they are not necessarily shorting individual US stocks aggressively; they are hedging through indices and ETFs.
That has pushed short exposure in US macro products to 10-year highs.
This creates two important implications.
First, hedge funds remain nervous about the US macro backdrop, including:
Iran / Middle East risk,
oil,
rates,
high valuations,
narrow leadership,
crowded AI and momentum positioning.
Second, because the hedges are concentrated in macro products, index-level squeeze risk is elevated. If oil falls, yields stabilize, or geopolitical headlines improve, hedge funds may be forced to cover index/ETF shorts, creating broad upside pressure even if single-name flows are not very bullish.
At the same time, hedge-fund net allocations to Asia have increased, while allocations to North America have fallen versus MSCI ACWI. These are now at their respective extremes since the data began in 2016: Asia at the high end, North America at the low end.
That suggests hedge funds prefer non-US equity exposure at the margin, likely because:
US valuations are stretched,
US positioning is crowded in AI/momentum,
Asia has more operating leverage to global trade and tech cycles,
Asian semis and memory remain leveraged to AI infrastructure,
China/Asia may benefit from tactical policy or liquidity support.
Performance: hedge funds ahead, mutual funds struggling
Equity hedge funds have returned around 7% YTD, while only around 30% of large-cap fundamental mutual funds are beating their benchmarks.
That gap is important. Hedge funds appear to have navigated the factor and regional rotations better, while mutual funds are struggling with benchmark concentration and leadership dynamics.
For large-cap mutual funds, the challenge is especially clear:
benchmarks are heavily influenced by Mag 7 and AI leaders,
many mutual funds remain underweight mega-cap tech,
semis rallied aggressively,
momentum is up 30% YTD,
underweights to benchmark winners are hard to overcome.
When only 30% of large-cap mutual funds are outperforming, it can create pressure to chase winners or reduce cash if the market continues higher. But it can also create vulnerability if crowded winners reverse.
Shared positioning: Healthcare, Industrials, Materials
Both hedge funds and large-cap mutual funds are overweight:
Healthcare,
Industrials,
Materials.
This shared overweight is notable because it suggests investors have been looking for non-tech or less crowded cyclical/defensive exposure while still participating in equity upside.
The shared-favorites basket has returned around 10% YTD, which is solid but far behind Momentum’s 30% return. That helps explain why managers can have reasonable stock picks and still lag benchmarks if they are underweight the dominant momentum/AI complex.
Rotation from Software into Semis
One of the most important positioning shifts is the rotation from Software into Semiconductors.
Both mutual funds and hedge funds moved from Software into Semis during Q1. Asset managers were effectively forced into Semis as the group rallied, and the mutual-fund tilt toward Semis versus Software ex-mega caps is now the largest since 2012.
This is a crowding warning.
The semi trade is supported by strong fundamentals: AI capex, NVDA validation, memory demand, networking, power, cooling, and cloud infrastructure. But the positioning has become increasingly stretched, especially relative to Software.
The risk is not that the AI thesis is wrong. The risk is that too much capital has rotated into the same part of the AI value chain at the same time.
That means:
semis are more vulnerable to profit taking,
software could catch a relative bid if investors diversify,
earnings beats in semis may get sold if expected,
factor reversals can be sharp,
AI exposure may migrate toward laggards and second derivatives.
Momentum: strong but stretched
Momentum is up around 30% YTD, making it one of the dominant factor trades of the year. But positioning now looks stretched, and this week saw pressure in the factor as investors took profits and diversified portfolios.
This fits the broader tape. The market has had several sessions where momentum sold off despite indices holding up or even rallying. That is a classic sign of factor rotation beneath the surface.
The issue is that momentum is now tied closely to:
Semis,
AI infrastructure,
high-beta tech,
crowded growth,
selected retail/speculative winners.
When momentum becomes crowded, it can unwind even without a negative fundamental catalyst. A small shock — rates, oil, geopolitics, earnings disappointment, or simply position reduction — can trigger mechanical selling.
Mutual funds: underweight Mag 7, overweight Semis versus Software
Mutual funds are now 723bp underweight Mag 7.
That is a major benchmark problem. If Mag 7 continues to grind higher, mutual funds may keep struggling to keep up. If Mag 7 pauses and leadership broadens, underweight managers may finally have room to recover.
The more interesting nuance is that mutual funds have added Semis and cut Software, excluding mega-cap names like AAPL, AVGO, MSFT, and NVDA. Their tilt toward Semis versus Software ex-mega caps is now the largest since 2012.
This suggests many managers have tried to solve their Mag 7 underweight by buying AI-adjacent semis rather than simply buying the largest benchmark names. That can work if semis continue leading, but it also concentrates risk in the same factor and theme.
SpaceX IPO watch: potential liquidity event
There is growing focus on the potential SpaceX IPO. Goldman’s US strategy team notes that mutual funds have historically increased cash positions ahead of the largest IPOs.
That matters because a very large IPO can temporarily drain liquidity from the secondary market, especially if mutual funds raise cash to participate.
Potential market implications:
cash balances could rise ahead of the deal,
some existing winners may be trimmed as funding sources,
high-growth/innovation funds may rebalance,
aerospace, defense, space, and private-market proxy names could see positioning shifts,
post-IPO flows could affect broader growth-stock liquidity.
This is not necessarily bearish, but it is another reason to watch liquidity and funding dynamics into summer.
Market implications
The current positioning backdrop creates a few clear conclusions.
1. Index downside is cushioned, but upside may be squeeze-driven
High RAI suggests limited probability of major rallies or sell-offs, but macro-product short exposure at 10-year highs creates upside squeeze risk if the macro backdrop improves.
That means a sharp index rally can still happen, but it may be driven more by covering than by fresh conviction.
2. Alpha should matter more than beta
If high RAI historically leads to lower large-move risk, then the opportunity set shifts toward dispersion and relative value.
This favors:
stock selection,
sector rotation,
long/short alpha,
quality laggards,
earnings revision winners,
less crowded AI beneficiaries,
selective consumer and healthcare names.
3. Semis are fundamentally strong but crowded
The semi trade remains supported by AI infrastructure demand, but mutual-fund and hedge-fund positioning has become stretched. The semi/software relative tilt is extreme.
This argues for not abandoning semis, but reducing concentration and using strength to diversify.
4. Software may be due for relative stabilization
Software has been a funding source, but if investors diversify out of crowded semis, software could benefit. Large long-dated downside buying in software suggests skepticism remains high, but that also means a good earnings or AI-monetization catalyst could produce a squeeze.
5. Mag 7 underweight creates benchmark pressure
With mutual funds 723bp underweight Mag 7, continued mega-cap strength would pressure active managers. That may create forced buying if the group keeps leading.
But if leadership broadens, active managers may finally improve relative performance.
6. Asia is increasingly favored over the US
Hedge funds are at record relative allocation extremes: more Asia, less North America. This is a major regional positioning statement.
The risk is that if US macro improves or US mega-cap tech reaccelerates, the US underweight becomes painful.
Trading takeaway
The market is not simply “too bullish.” It is more complicated.
Aggregate risk appetite is extremely high, but hedge funds are cautious on US equities and heavily hedged through macro shorts. Mutual funds are underweight Mag 7, crowded in semis versus software, and many are underperforming benchmarks. Momentum has been very strong but is now stretched. Asia is gaining favor at the expense of North America.
This creates a market where the biggest near-term risks are:
a momentum unwind,
a semi crowding reversal,
an index squeeze from macro short covering,
forced mutual-fund chasing if Mag 7 keeps rising,
liquidity drain ahead of a very large IPO,
sharp rotations rather than broad index breakdowns.
Disclaimer: The material provided is for information purposes only and should not be considered as investment advice. The views, information, or opinions expressed in the text belong solely to the author, and not to the author’s employer, organization, committee or other group or individual or company.
Past performance is not indicative of future results.
High Risk Warning: CFDs are complex instruments and come with a high risk of losing money rapidly due to leverage. 68% and 74% of retail investor accounts lose money when trading CFDs with Tickmill UK Ltd and Tickmill Europe Ltd respectively. You should consider whether you understand how CFDs work and whether you can afford to take the high risk of losing your money.
Futures and Options: Trading futures and options on margin carries a high degree of risk and may result in losses exceeding your initial investment. These products are not suitable for all investors. Ensure you fully understand the risks and take appropriate care to manage your risk.
Patrick has been involved in the financial markets for well over a decade as a self-educated professional trader and money manager. Flitting between the roles of market commentator, analyst and mentor, Patrick has improved the technical skills and psychological stance of literally hundreds of traders – coaching them to become savvy market operators!