S&P500 Loses Momentum
Good day!
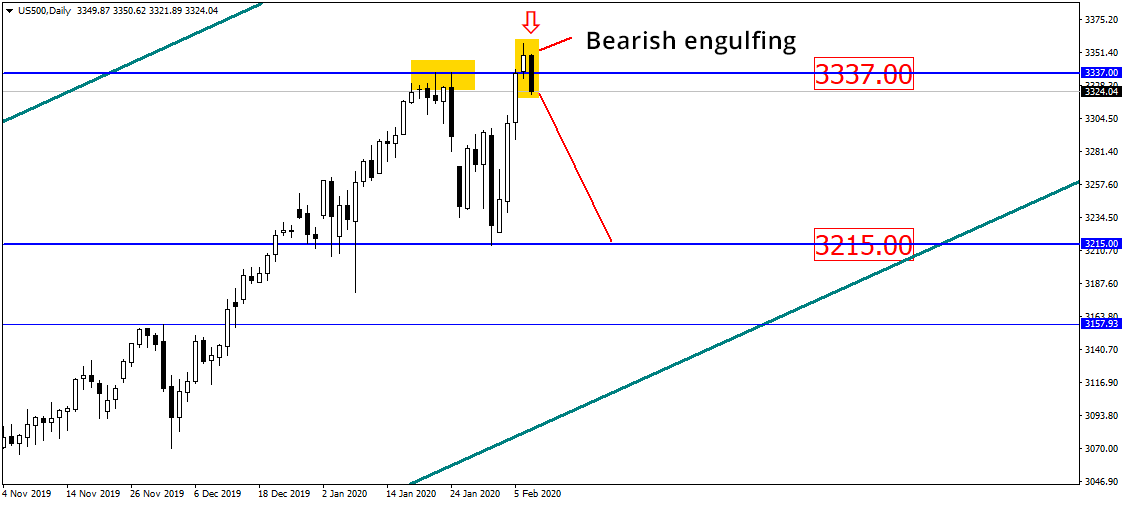
In the daily chart, the price of the American stock index S&P500 closed Friday with a very fine bearish engulfing at the resistance level of 3337.00, which is also recently formed historical maximum. The index might potentially drop till the level of 3215.00:
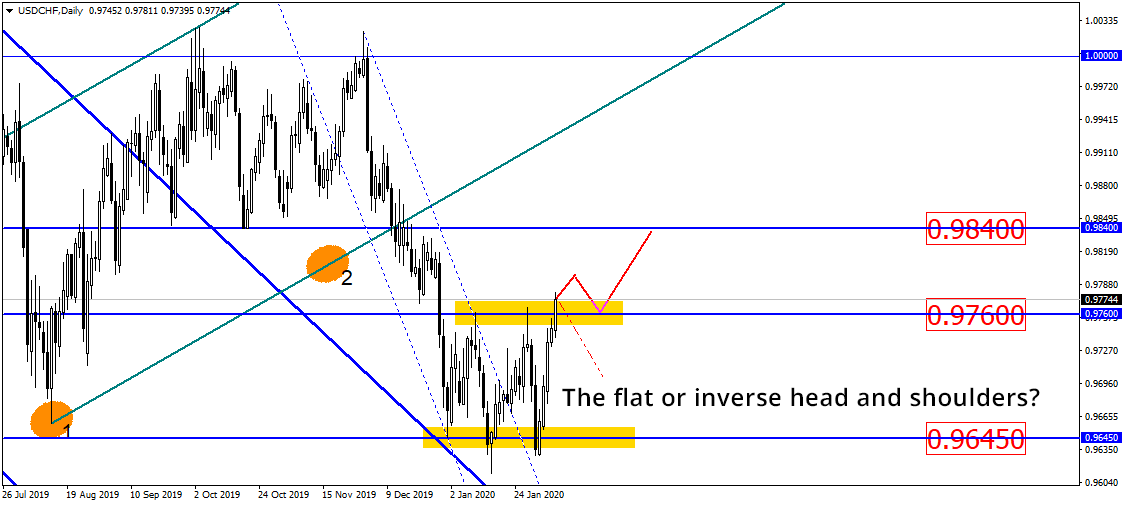
The Swiss franc broke the resistance level of 0.9645. However, the asset did not secure the position behind the broken line with three candles therefore the true breakdown is not quite clear yet. In principle, the asset could potentially jump so we should rely on the candlestick patterns. Should Monday close with a black candle, the currency pair might drop:
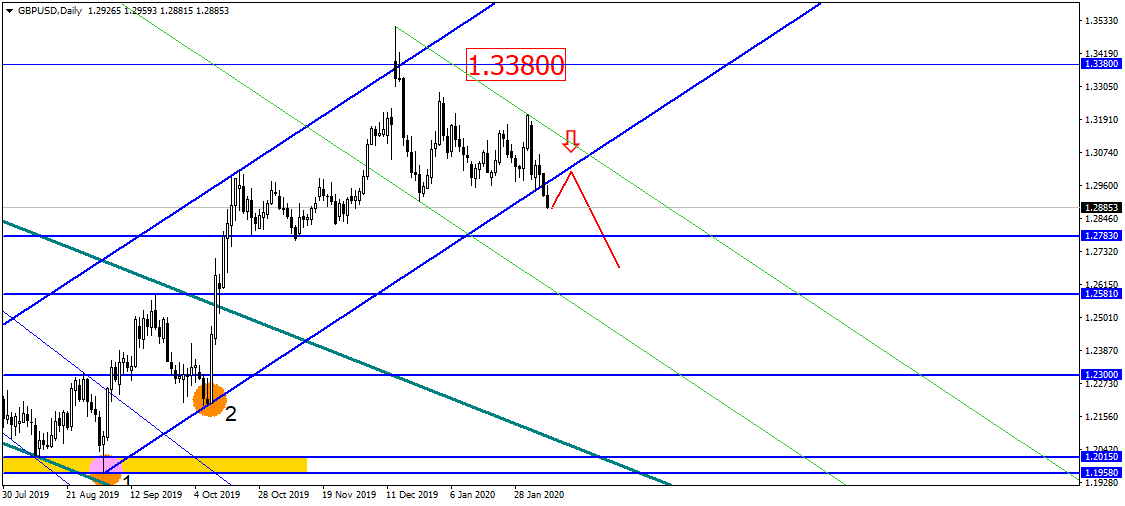
British pound broke daily uptrend therefore it might pull from the broken trendline and the currency pair might approach the level of 1.2300, that is, the width of this trend:
Disclaimer: The material provided is for information purposes only and should not be considered as investment advice. The views, information, or opinions expressed in the text belong solely to the author, and not to the author’s employer, organization, committee or other group or individual or company.
High Risk Warning: CFDs are complex instruments and come with a high risk of losing money rapidly due to leverage. 73% and 70% of retail investor accounts lose money when trading CFDs with Tickmill UK Ltd and Tickmill Europe Ltd respectively. You should consider whether you understand how CFDs work and whether you can afford to take the high risk of losing your money.
Disclaimer: The material provided is for information purposes only and should not be considered as investment advice. The views, information, or opinions expressed in the text belong solely to the author, and not to the author’s employer, organization, committee or other group or individual or company.
Past performance is not indicative of future results.
High Risk Warning: CFDs are complex instruments and come with a high risk of losing money rapidly due to leverage. 69% and 73% of retail investor accounts lose money when trading CFDs with Tickmill UK Ltd and Tickmill Europe Ltd respectively. You should consider whether you understand how CFDs work and whether you can afford to take the high risk of losing your money.
Futures and Options: Trading futures and options on margin carries a high degree of risk and may result in losses exceeding your initial investment. These products are not suitable for all investors. Ensure you fully understand the risks and take appropriate care to manage your risk.