WTI Drops: What’s Next?
Good day!
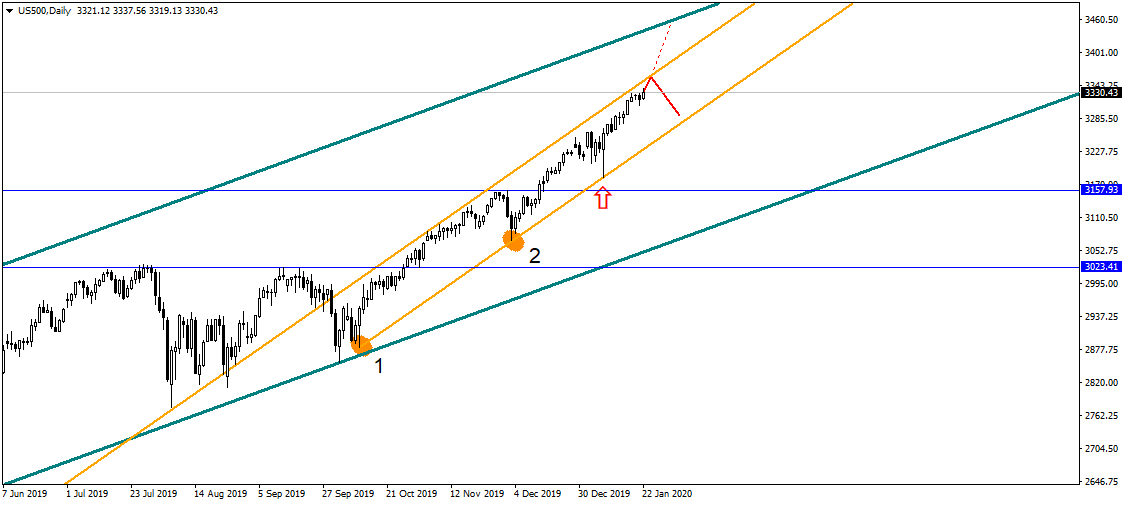
The American index is approaching the upper boundary of the uptrend (marked in orange) therefore the asset will probably correct itself soon away from this boundary. Of course, the asset can also do exactly the opposite thing and break the boundary. In this case, it might mean that asset’s price has reached the trendline of the uptrend from the elder time frame (marked in gray). All in all, we’d better wait and see what happens next:
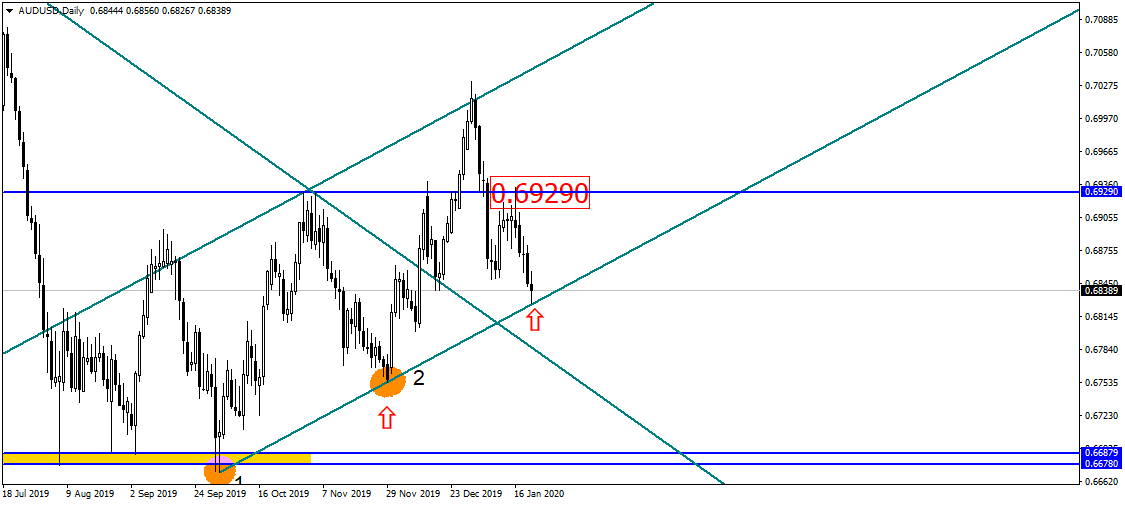
Australian dollar has touched the daily uptrend, therefore we should wait for a hammer or bullish engulfing to form as they will confirm whether the currency pair is about to head North. So far, Australian dollar is on the rise:
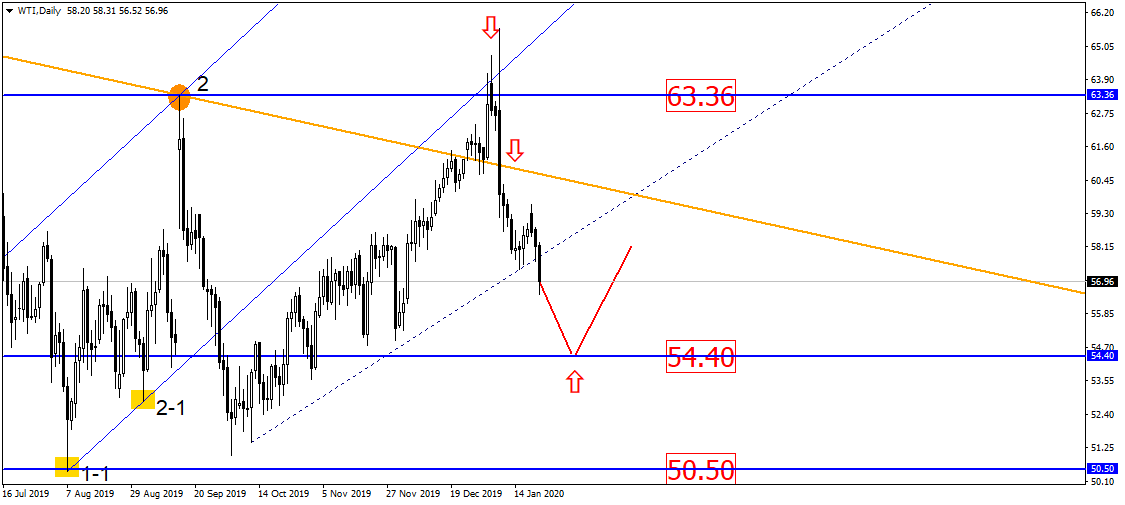
Oil is slowly going down. The level of 54.50 should support the asset first. Away from this level the oil might jump. This is the target level in terms of the broken uptrend. Yet the oil is not going to drop too far:
Disclaimer: The material provided is for information purposes only and should not be considered as investment advice. The views, information, or opinions expressed in the text belong solely to the author, and not to the author’s employer, organization, committee or other group or individual or company.
High Risk Warning: CFDs are complex instruments and come with a high risk of losing money rapidly due to leverage. 73% and 70% of retail investor accounts lose money when trading CFDs with Tickmill UK Ltd and Tickmill Europe Ltd respectively. You should consider whether you understand how CFDs work and whether you can afford to take the high risk of losing your money.
Disclaimer: The material provided is for information purposes only and should not be considered as investment advice. The views, information, or opinions expressed in the text belong solely to the author, and not to the author’s employer, organization, committee or other group or individual or company.
Past performance is not indicative of future results.
High Risk Warning: CFDs are complex instruments and come with a high risk of losing money rapidly due to leverage. 69% and 73% of retail investor accounts lose money when trading CFDs with Tickmill UK Ltd and Tickmill Europe Ltd respectively. You should consider whether you understand how CFDs work and whether you can afford to take the high risk of losing your money.
Futures and Options: Trading futures and options on margin carries a high degree of risk and may result in losses exceeding your initial investment. These products are not suitable for all investors. Ensure you fully understand the risks and take appropriate care to manage your risk.