Bitcoin Forecast: Potential Price Drop Ahead!
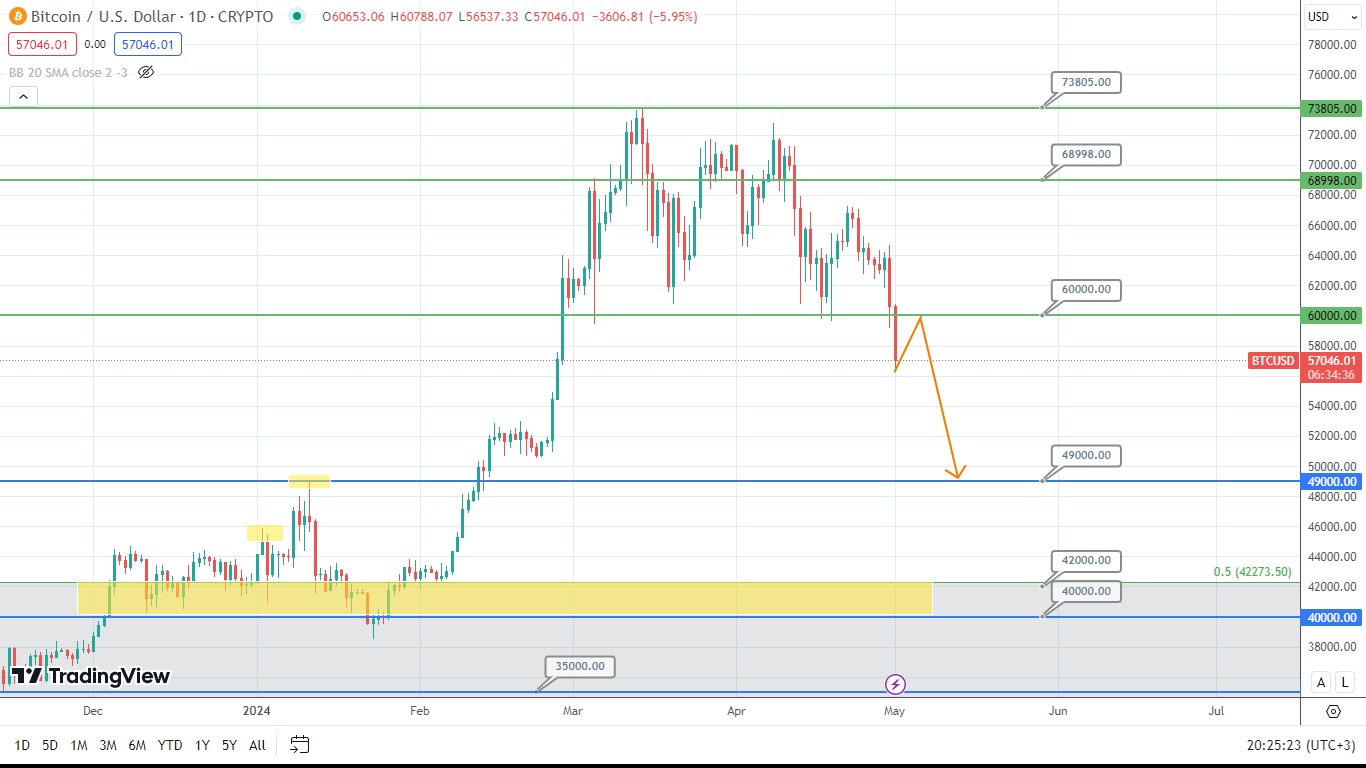
The price of Bitcoin has formed the bearish engulfing at the end of April. The daily chart also shows that the price of this asset has dropped and formed a double top. As for now, the asset’s price broke the psychological supporting level of 60000. Once the price of Bitcoin gets back to this level, it might rebound and drop. So, let’s wait and see what is going to be the next price movement of this asset.
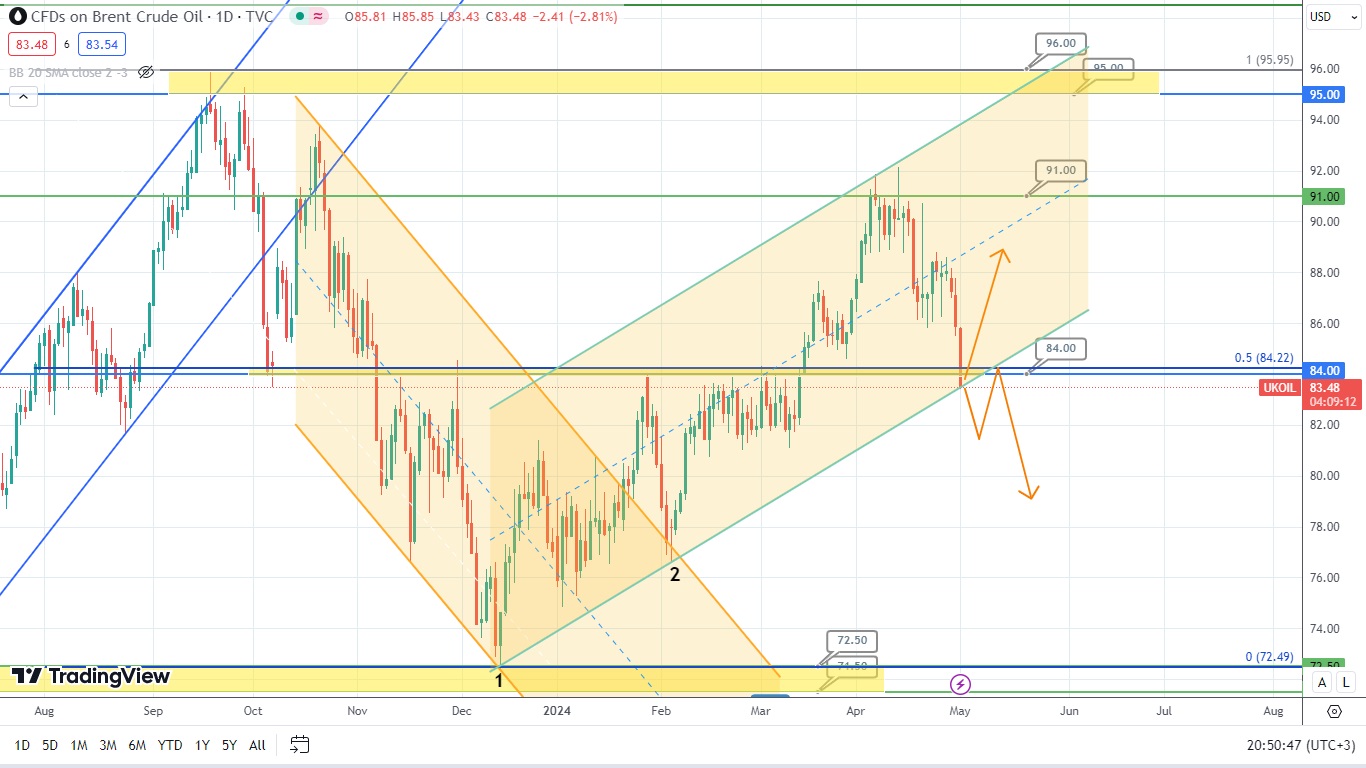
The price of Brent oil is testing the level of 84.00 and uptrend. Should the price of this asset rebound from this level and rise, it might hit the level of 91. If the price of Brent oil breaks this level and the uptrend, it might also drop and gain support at the level of 73.00. Hence, it would be interesting to follow the price movements at the crossing point of the above mentioned level and the uptrend to forecast the upcoming scenario.
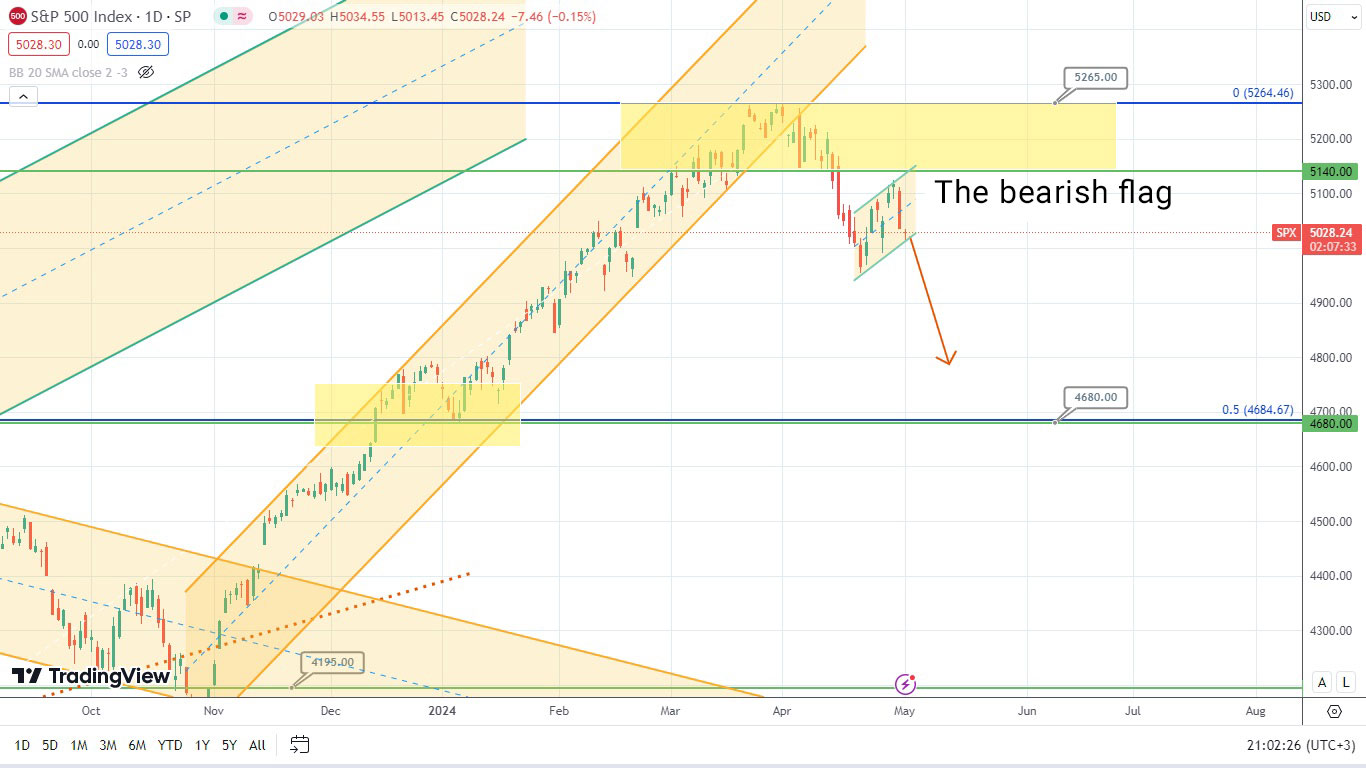
The price of the American stock index S&P500 has jumped. Now, it is trying to form the bearish flag. Should the price of this asset break the lower side of a flag, it might abruptly drop. However, it should still target the supporting level of 4680 to gain the required support. Time will tell what is going to happen next.

Disclaimer: The material provided is for information purposes only and should not be considered as investment advice. The views, information, or opinions expressed in the text belong solely to the author, and not to the author’s employer, organization, committee or other group or individual or company.
Past performance is not indicative of future results.
High Risk Warning: CFDs are complex instruments and come with a high risk of losing money rapidly due to leverage. 69% and 73% of retail investor accounts lose money when trading CFDs with Tickmill UK Ltd and Tickmill Europe Ltd respectively. You should consider whether you understand how CFDs work and whether you can afford to take the high risk of losing your money.
Futures and Options: Trading futures and options on margin carries a high degree of risk and may result in losses exceeding your initial investment. These products are not suitable for all investors. Ensure you fully understand the risks and take appropriate care to manage your risk.