SP500 LDN TRADING UPDATE 17/2/26

SP500 LDN TRADING UPDATE 17/2/26
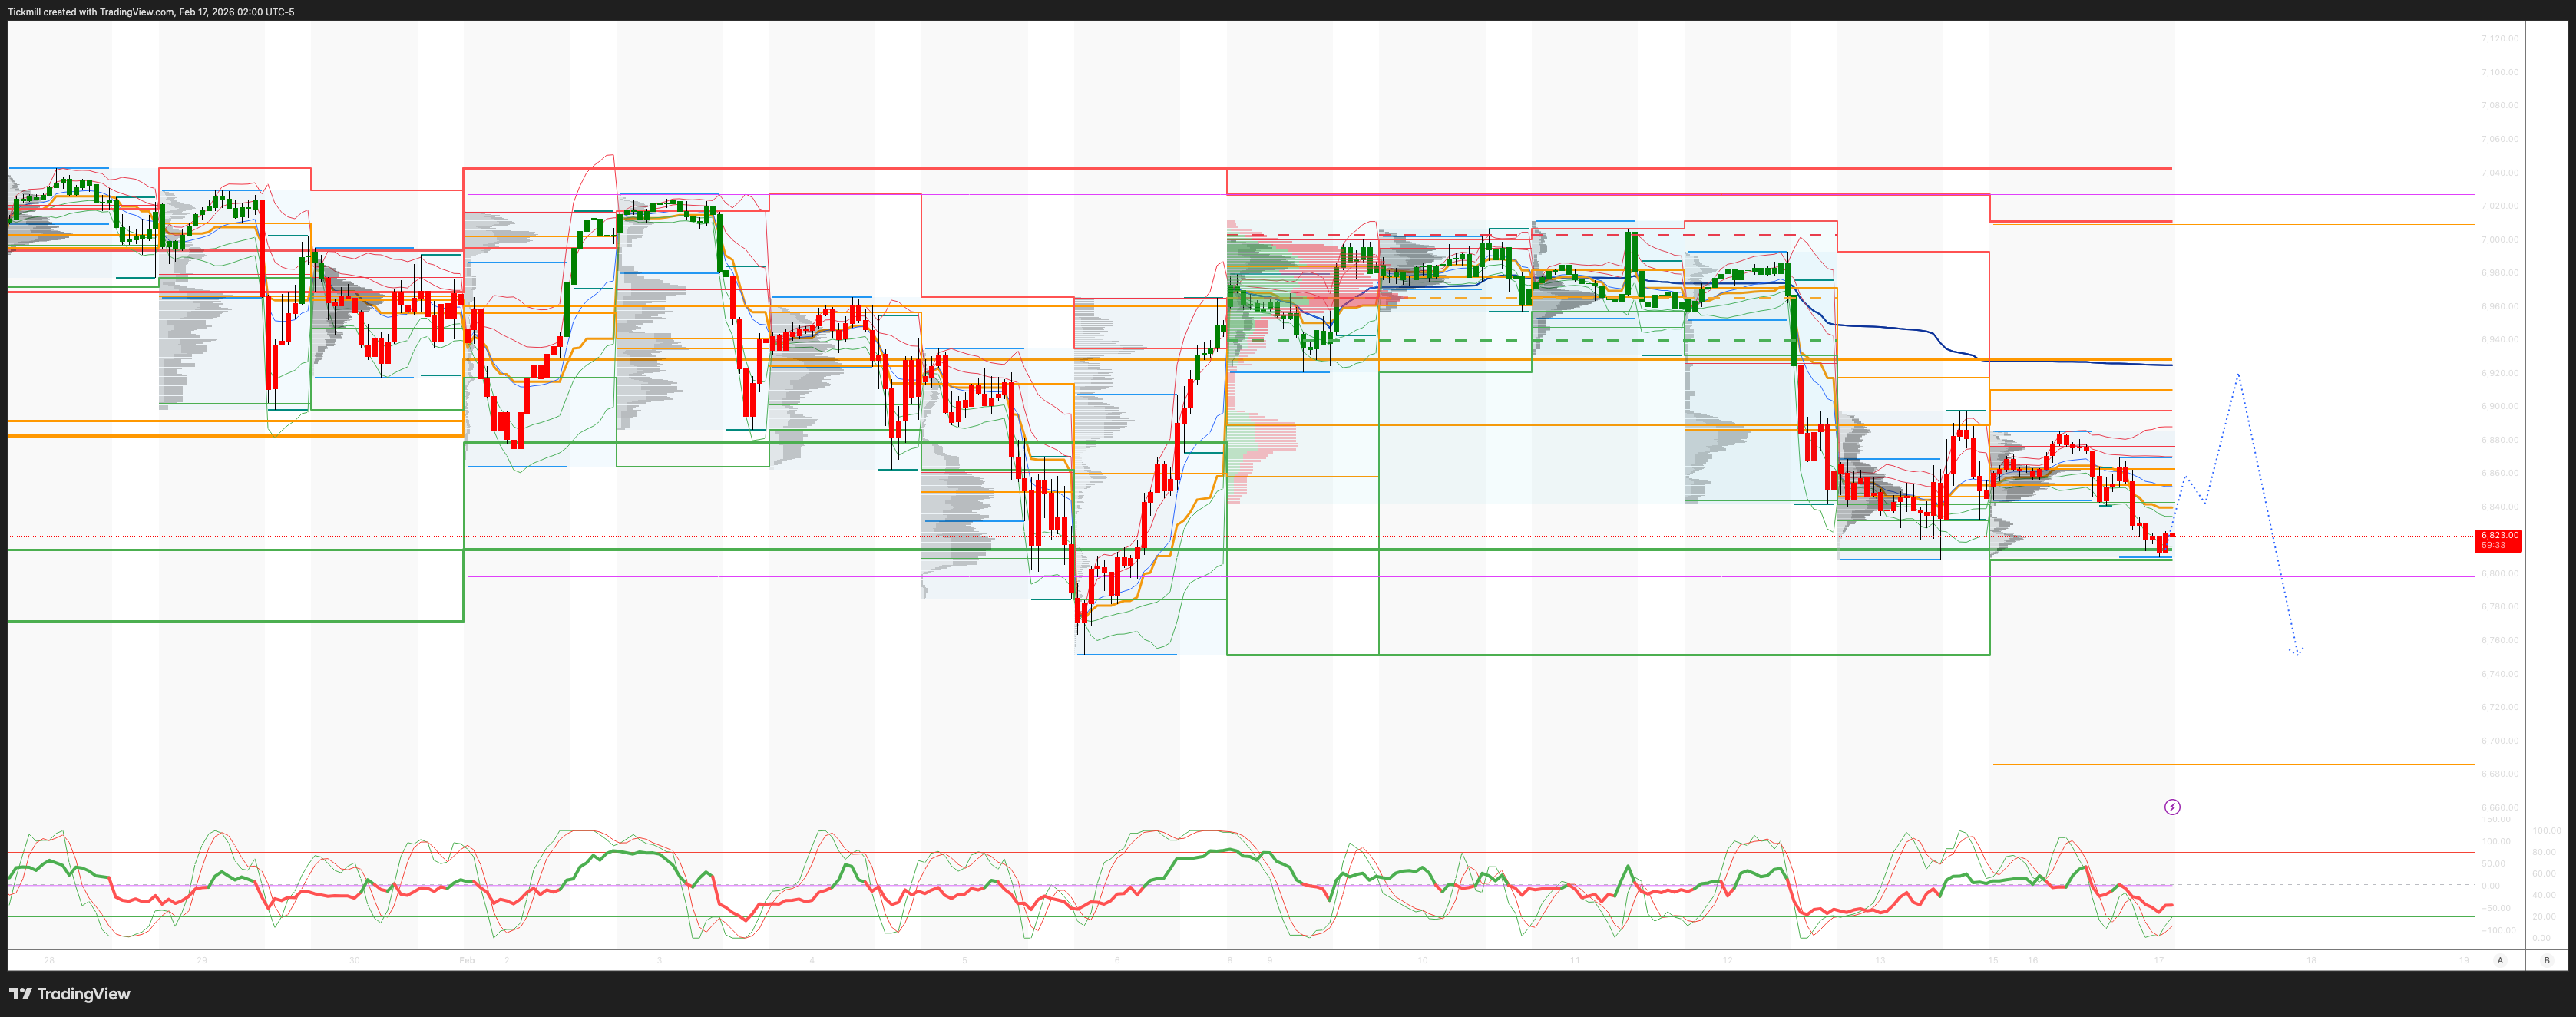
WEEKLY & DAILY LEVELS
***QUOTING ES1! FOR CASH US500 EQUIVALENT LEVELS, SUBTRACT POINT DIFFERENCE***
WEEKLY BULL BEAR ZONE 6925/35
WEEKLY RANGE RES 6980 SUP 6720
FEB EOM Straddle indicates a range of 214.6 points, suggesting a monthly FEB range of [6725, 7154].
FEB OPEX Straddle shows a range of 213.6 points, leading to an OPEX to OPEX range of [6726, 7154].
MAR QOPEX Straddle offers a range of 368.55 points, resulting in a range of [6466, 7203].
The range from DEC2025 OPEX to DEC2026 OPEX is 945 points, providing a range of [5889, 7779].
DAILY VWAP BEARISH 6886
WEEKLY VWAP BEARISH 6928
MONTHLY VWAP BULLISH 6865
DAILY STRUCTURE – ONE TIME FRAMING LOWER - 6897
WEEKLY STRUCTURE – BALANCE - 7031/6801
MONTHLY STRUCTURE – TBC
DAILY RANGE RES 6907 SUP 6784
2 SIGMA RES 6969 SUP 6722
VIX BULL BEAR ZONE 20
PUT/CALL RATIO 1.64 (The numbers reflect options traded during the current session. A put-call ratio below 0.7 is generally considered bullish, and a put-call ratio above 1.0 is generally considered bearish)
TRADES & TARGETS
SHORT ON REJECT/RECLAIM WEEKLY BULL BEAR ZONE TARGET 6720
LONG ON REJECT/RECLAIM OF WEEKLY SUP TARGET WEEKLY BULL BEAR ZONE
(I FADE TESTS OF 2 SIGMA LEVELS ESPECIALLY INTO THE FINAL HOUR OF THE NY CASH SESSION AS 90% OF THE TIME WHEN TESTED THE MARKET WILL CLOSE ABOVE OR BELOW THESE LEVELS)
GOLDMAN SACHS TRADING DESK VIEW - ‘Nowhere To Hide’
Each trading week appears to either match or exceed the intensity of the previous one. Reflecting on the current environment, as Tony P aptly put it, “outside of periods of significant trauma—like the GFC or COVID—I can’t recall a time that was this noisy, this high velocity, this wide open.” Presently, even a perceived incremental AI risk can trigger a violent sell-off in the market.
Weekly Market Performance:
- RTY: -89bps
- NDX: -137bps
- S&P: -139bps
The broadening-out trade continued with cyclicals and defensives showing strength, while the Mag7 stocks faced challenges. Single-stock volatility was notable, with Thursday seeing over 40 names in the S&P experiencing moves greater than 3 sigma—the second-highest occurrence year-to-date. A striking observation from Michael Bantick: “Over the last 8 sessions, 115 stocks in the S&P 500 have declined by -7% or more in a single day. Historically, the average drawdown in such cases is -34%. Currently, we’re about -2.5% below the all-time high.”
Risk Appetite Indicators:
- Verizon (VZ) outperformed the market by approximately 27 points over the last 12 sessions, marking its most significant outperformance over a 12-day stretch since 1987.
- Amazon (AMZN) declined for nine consecutive sessions, its longest losing streak since 2006 (credit to Pete Callahan).
Weekly Movers:
- Best Performing Baskets:
- 12M Winners: +529bps
- Bond Proxies: +439bps
- Metals: +582bps
- AI Winners vs. AI at Risk: +12%
- Worst Performing Baskets:
- Memes: -745bps
- Quantum: -720bps
- 12M Losers: -357bps
- Mag7: -323bps
- Mega Cap vs. Non-Profitable Tech: -390bps
- Top Positive Contributions to the S&P:
- ORCL, AMAT, CAT, MU, TSLA
- Top Negative Contributions to the S&P:
- AAPL, AMZN, GOOGL, NVDA, JPM
AI-Driven Market Sentiment:
Media coverage of AI-related panic reached one of the highest levels year-to-date. Despite the risk-off sentiment, software stocks declined only -55bps compared to over -700bps in the prior two weeks, signaling a moderation in the downside momentum.
Sector-Specific Downside Movers:
- Transports: CHRW (-12%)
- Wealth: SCHW (-10%), LPLA (-13%)
- Insurance Brokers: AJG (-13%), WTW (-12%)
- CRE Brokers: CBRE (-16%), JLL (-15%)
- Info Services: SPGI (-7%), MCO (-6%), MSCI (-6%) (with the previous week being even worse)
- Office REITs: BXP (-5%), KRC (-9%), VNO (-4%)
- HC CROs: GSHLCCRO (-17%)
The market remains highly volatile, with sectors and individual stocks experiencing significant fluctuations. The environment demands vigilance as risks and opportunities continue to evolve rapidly.
Our desk remained highly active this week, though at a slightly slower pace compared to the previous week. Last week felt more like a capitulation, with both Hedge Funds (HFs) and Long-Only (LO) investors collectively ending as net sellers of -$4 billion. This week, both groups were again net sellers but at a reduced level of -$1 billion, with the selling appearing more systematic in nature. Broadly, we continue to observe similar rotation trends in our flows, with buying focused on Utilities, Industrials, Staples, REITs, and Energy, while selling remains concentrated in Technology, Media, and Telecom (TMT).
On our Prime book, there are indications of de-grossing activity as U.S. Long/Short (L/S) Gross leverage declined for the second consecutive week by -1.5 points (-6.4 points month-to-date), though it remains elevated, sitting in the 98th percentile over the past five years. After four straight weeks of net selling, HFs showed modest net buying of U.S. equities this week, driven by long purchases in Macro Products outpacing short sales in Single Stocks. The Information Technology sector experienced its largest net buying since December 2021 (though it remains net sold year-to-date), primarily led by increased buying in Semiconductors and a tapering of supply in Software. Conversely, Consumer Discretionary was the most net sold sector, witnessing the largest risk unwinds in over five years. (Credit: Vinny Lin)
Disclaimer: The material provided is for information purposes only and should not be considered as investment advice. The views, information, or opinions expressed in the text belong solely to the author, and not to the author’s employer, organization, committee or other group or individual or company.
Past performance is not indicative of future results.
High Risk Warning: CFDs are complex instruments and come with a high risk of losing money rapidly due to leverage. 69% and 73% of retail investor accounts lose money when trading CFDs with Tickmill UK Ltd and Tickmill Europe Ltd respectively. You should consider whether you understand how CFDs work and whether you can afford to take the high risk of losing your money.
Futures and Options: Trading futures and options on margin carries a high degree of risk and may result in losses exceeding your initial investment. These products are not suitable for all investors. Ensure you fully understand the risks and take appropriate care to manage your risk.
Patrick has been involved in the financial markets for well over a decade as a self-educated professional trader and money manager. Flitting between the roles of market commentator, analyst and mentor, Patrick has improved the technical skills and psychological stance of literally hundreds of traders – coaching them to become savvy market operators!