Institutional Insights; Goldman Sachs - Flow of Funds 'The Force of May'

GS Flow of Funds — “The Force of May”
### Actionable Trader Takeaways
Bottom line: the near-term technical setup has turned more difficult. The rally has burned through a lot of the easy systematic demand, positioning is no longer clean, month-end brings meaningful pension selling, and retail’s tax-refund passive bid is fading. The desk’s message is not “crash,” but expect the market to let off steam and remove froth before May buybacks/risk-parity/NDX seasonality can reassert support.
---
## 1. CTAs: the bid is gone
The CTA impulse that helped power the rally is now largely exhausted.
- Systematic strategies bought almost $80bn of US equities over the past month.
- CTAs are now long roughly $44bn of US equities.
- But incremental demand has dried up and CTAs have flipped to small sellers.
- If downside thresholds break, CTAs could sell up to $50bn of US equities.
### Trading read-through
This removes a major support pillar from the tape. The rally is now more dependent on earnings, buybacks and discretionary risk appetite.
Actionable take:
Do not chase index strength blindly here. If SPX starts losing short- and medium-term trend thresholds, the CTA flow turns from neutral to actively negative.
Key CTA scenarios:
| Horizon | Flat Tape | Up Tape | Down Tape |
|---|---:|---:|---:|
| 1 week | Sell $7.7bn globally | Sell $2.3bn | Sell $17.5bn |
| 1 month | Sell $20.1bn | Buy $10.1bn | Sell $149bn globally / $50bn US |
---
## 2. Month-end pensions: real supply to absorb
US pensions are modeled to sell $27bn of US equities into month-end.
That is:
- 86th percentile in absolute size over the past three years.
- 93rd percentile going back to 2000.
- The largest non-quarterly month-end sell estimate in the dataset.
### Trading read-through
There is likely “wood to chop” into the April close. This supply does not automatically mean a selloff, but it makes upside harder unless earnings/buybacks overwhelm it.
Actionable take:
Fade weak intraday rallies into month-end unless there is clear megacap-led breadth confirmation. Be careful extrapolating strong futures into cash if pension supply is still ahead.
---
## 3. Retail: from “buy the dip” to “trade the mania”
Retail participation has shifted. The tax-refund passive bid is fading, and May has historically been the largest outflow month for equity mutual funds and ETFs.
More importantly, retail activity is now concentrated in thematic levered products:
- SOXL retail participation: 99th percentile on a 5y lookback.
- SOXS retail participation: 97th percentile on a 5y lookback.
### Trading read-through
Retail is no longer just levering index beta. It is aggressively trading sector narratives, especially semis.
Actionable take:
Expect more violent thematic rotations under the hood. Semis can gap both ways. Use options or defined-risk structures rather than chasing levered ETF-driven moves.
---
## 4. Vol: index calm, single-stock tension
Index implied vol has reset meaningfully lower since the geopolitical shock, but single-stock vol remains firm.
The spread between average S&P single-stock vol and index vol is now in the 99th percentile on both a 1y and 5y lookback.
### Trading read-through
The market is shifting from beta hedging to stock-picking. Correlation has fallen, dispersion is high, and single-name outcomes matter more than index direction.
Actionable take:
Prefer dispersion / relative-value / pair trades over blunt index beta. Index vol may look subdued, but single-stock event risk remains expensive and relevant.
---
## 5. Dealer gamma: downside cushioned, upside harder but faster if it breaks
GS estimates dealers are:
- Long gamma at spot.
- Longer gamma on selloffs.
- Shorter gamma on rallies.
### Trading read-through
This setup should mute downside moves near term, but rallies can become more mechanically amplified if spot pushes higher and dealers get shorter gamma.
Actionable take:
Expect orderly dips rather than immediate disorder, but also be alert to upside squeezes if megacap earnings force spot higher. This is a market for tactical ranges until levels break.
---
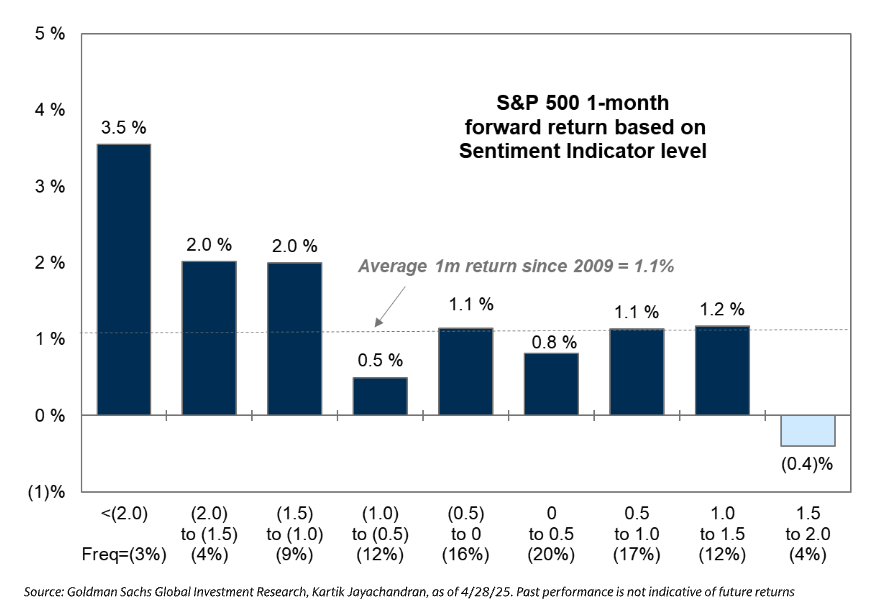
## 6. Positioning: no longer clean
Institutional positioning has become stretched.
- GS Sentiment Indicator reached +1.5 last week.
- Risk Appetite Indicator is now in the 99th percentile on a 5y lookback, up from the 34th percentile a month ago.
- Hedge fund gross leverage is 308.3%, still 97th percentile on a 5y lookback.
- Non-dealer positioning in US index futures is in the 89th percentile on a 1y lookback.
### Trading read-through
The market is less squeeze-prone than it was. A lot of the forced re-risking has already happened.
Actionable take:
Upside now needs fresh fundamental validation. If consensus views are tested — oil, Fed, earnings, AI capex — positioning can amplify a correction.
---
## 7. Buybacks: the main May offset
The supportive factor is corporate buybacks.
- Roughly 40% of corporates are now in open window.
- Open windows should remain supportive until around June 12.
- 2026 YTD buyback authorizations are already $502.3bn.
### Trading read-through
Buybacks should provide a medium-term floor, especially after earnings blackouts lift.
Actionable take:
Use forced-flow weakness to look for buyback-supported entries in quality names, especially where earnings are cleared and authorization capacity is visible.
---
## 8. Risk parity: possible delayed buyer
Risk parity may be the “last guest to arrive.”
- Positioning sits only around the 27th percentile on a 1y basis.
- Around the 29th percentile on a 5y basis.
- Lower index vol could lead this cohort to add exposure gradually.
### Trading read-through
This is not an immediate impulse like CTAs, but it could become a May stabilizer if realized/index vol remains contained.
Actionable take:
If the market chops sideways with lower vol, risk parity can become a slow tailwind. If vol spikes, that support disappears.
---
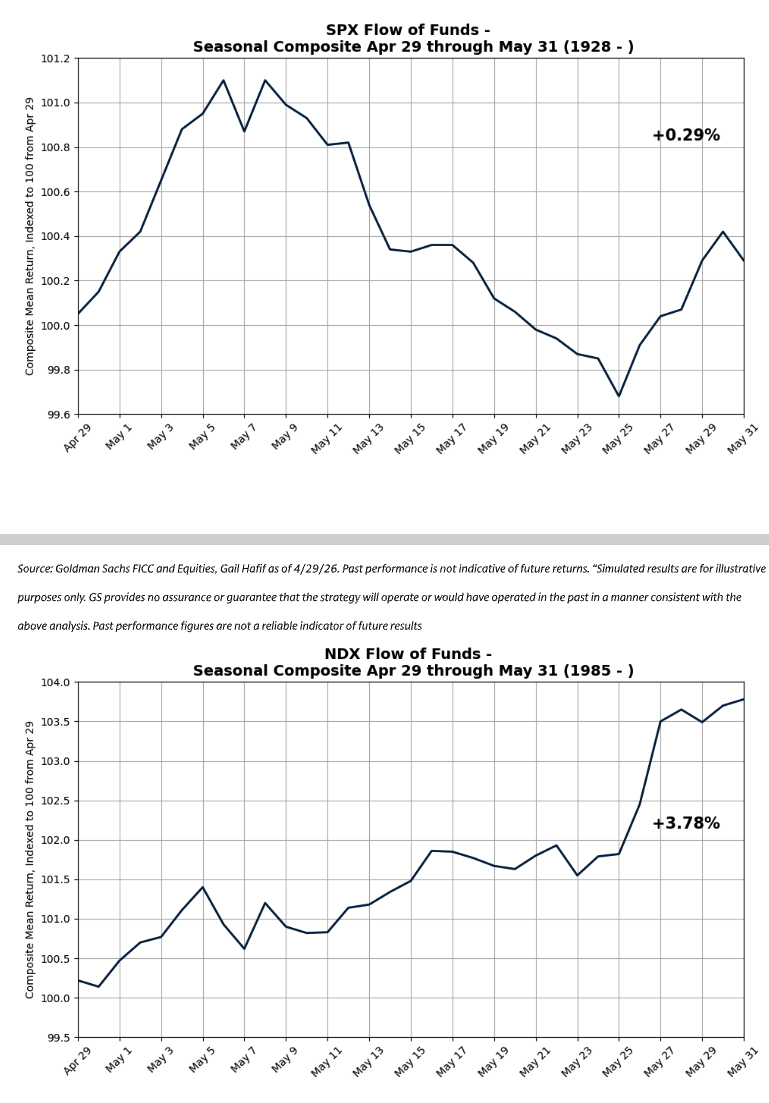
## 9. Seasonality: NDX over SPX remains the preferred May expression
May has historically been poor-to-mixed for SPX but strong for NDX.
- From April 29 to May 31, SPX average return since 1928: +0.29%.
- Same window for NDX since 1985: +3.78%.
- May is the 3rd best month for NDX.
- May is the 3rd worst month for SPX.
### Trading read-through
The desk is watching for continued Nasdaq outperformance, supported by secular growth, IPO activity and earnings catalysts.
Actionable take:
Prefer NDX over SPX rather than outright index longs if staying constructive. Growth leadership can persist even if broader SPX technicals cool.
---
# Preferred Expressions From the File
### Hedge
SPY 29May 700 / 660 put spread
Indicative cost: 5.55, reference 712
Max gross payout: 7.2x
Use case: near-term steam-release / froth-excision hedge.
---
### Geopolitical escalation
16Jul26 dual condition:
- RTY below 92.5%
- CLN6 above 110%
Indicative cost: 11.75%
Use case: equity downside plus oil upside escalation scenario.
---
### Historical/seasonal relative value
NDX > SPX Jul26 3% OTM outperformance
Indicative premium: 0.7%
Use case: express May Nasdaq seasonality and secular-growth leadership without taking pure market beta.
---
# Trader Playbook
## Near-term: defensive/tactical
- Do not chase SPX after the rally to ATHs.
- Respect month-end pension supply.
- Watch CTA trigger levels closely.
- Use put spreads rather than outright crash hedges given dealer gamma support.
- Expect orderly downside unless thresholds break.
## Under the hood: expect violence
- Retail is in thematic leverage, especially semis.
- Single-stock vol remains elevated versus index vol.
- Dispersion should stay high.
- Pair trades and sector RV likely beat blunt beta.
## Medium-term: buybacks and NDX can support
- Buybacks reopen after earnings and should help into June.
- Risk parity can add if vol stays low.
- NDX seasonality is strong.
- Prefer NDX over SPX if constructive.
## Main risk
The market has re-risked quickly, but the support mix has changed. The easy CTA bid is gone, retail passive inflows are fading, pensions are selling, and positioning is stretched. If earnings, oil, or Fed expectations challenge consensus, the tape is vulnerable to a pullback before May support reappears.
Disclaimer: The material provided is for information purposes only and should not be considered as investment advice. The views, information, or opinions expressed in the text belong solely to the author, and not to the author’s employer, organization, committee or other group or individual or company.
Past performance is not indicative of future results.
High Risk Warning: CFDs are complex instruments and come with a high risk of losing money rapidly due to leverage. 71% and 74% of retail investor accounts lose money when trading CFDs with Tickmill UK Ltd and Tickmill Europe Ltd respectively. You should consider whether you understand how CFDs work and whether you can afford to take the high risk of losing your money.
Futures and Options: Trading futures and options on margin carries a high degree of risk and may result in losses exceeding your initial investment. These products are not suitable for all investors. Ensure you fully understand the risks and take appropriate care to manage your risk.
Patrick has been involved in the financial markets for well over a decade as a self-educated professional trader and money manager. Flitting between the roles of market commentator, analyst and mentor, Patrick has improved the technical skills and psychological stance of literally hundreds of traders – coaching them to become savvy market operators!