S&P500 Daily Action Areas & Price Targets 1/10/26

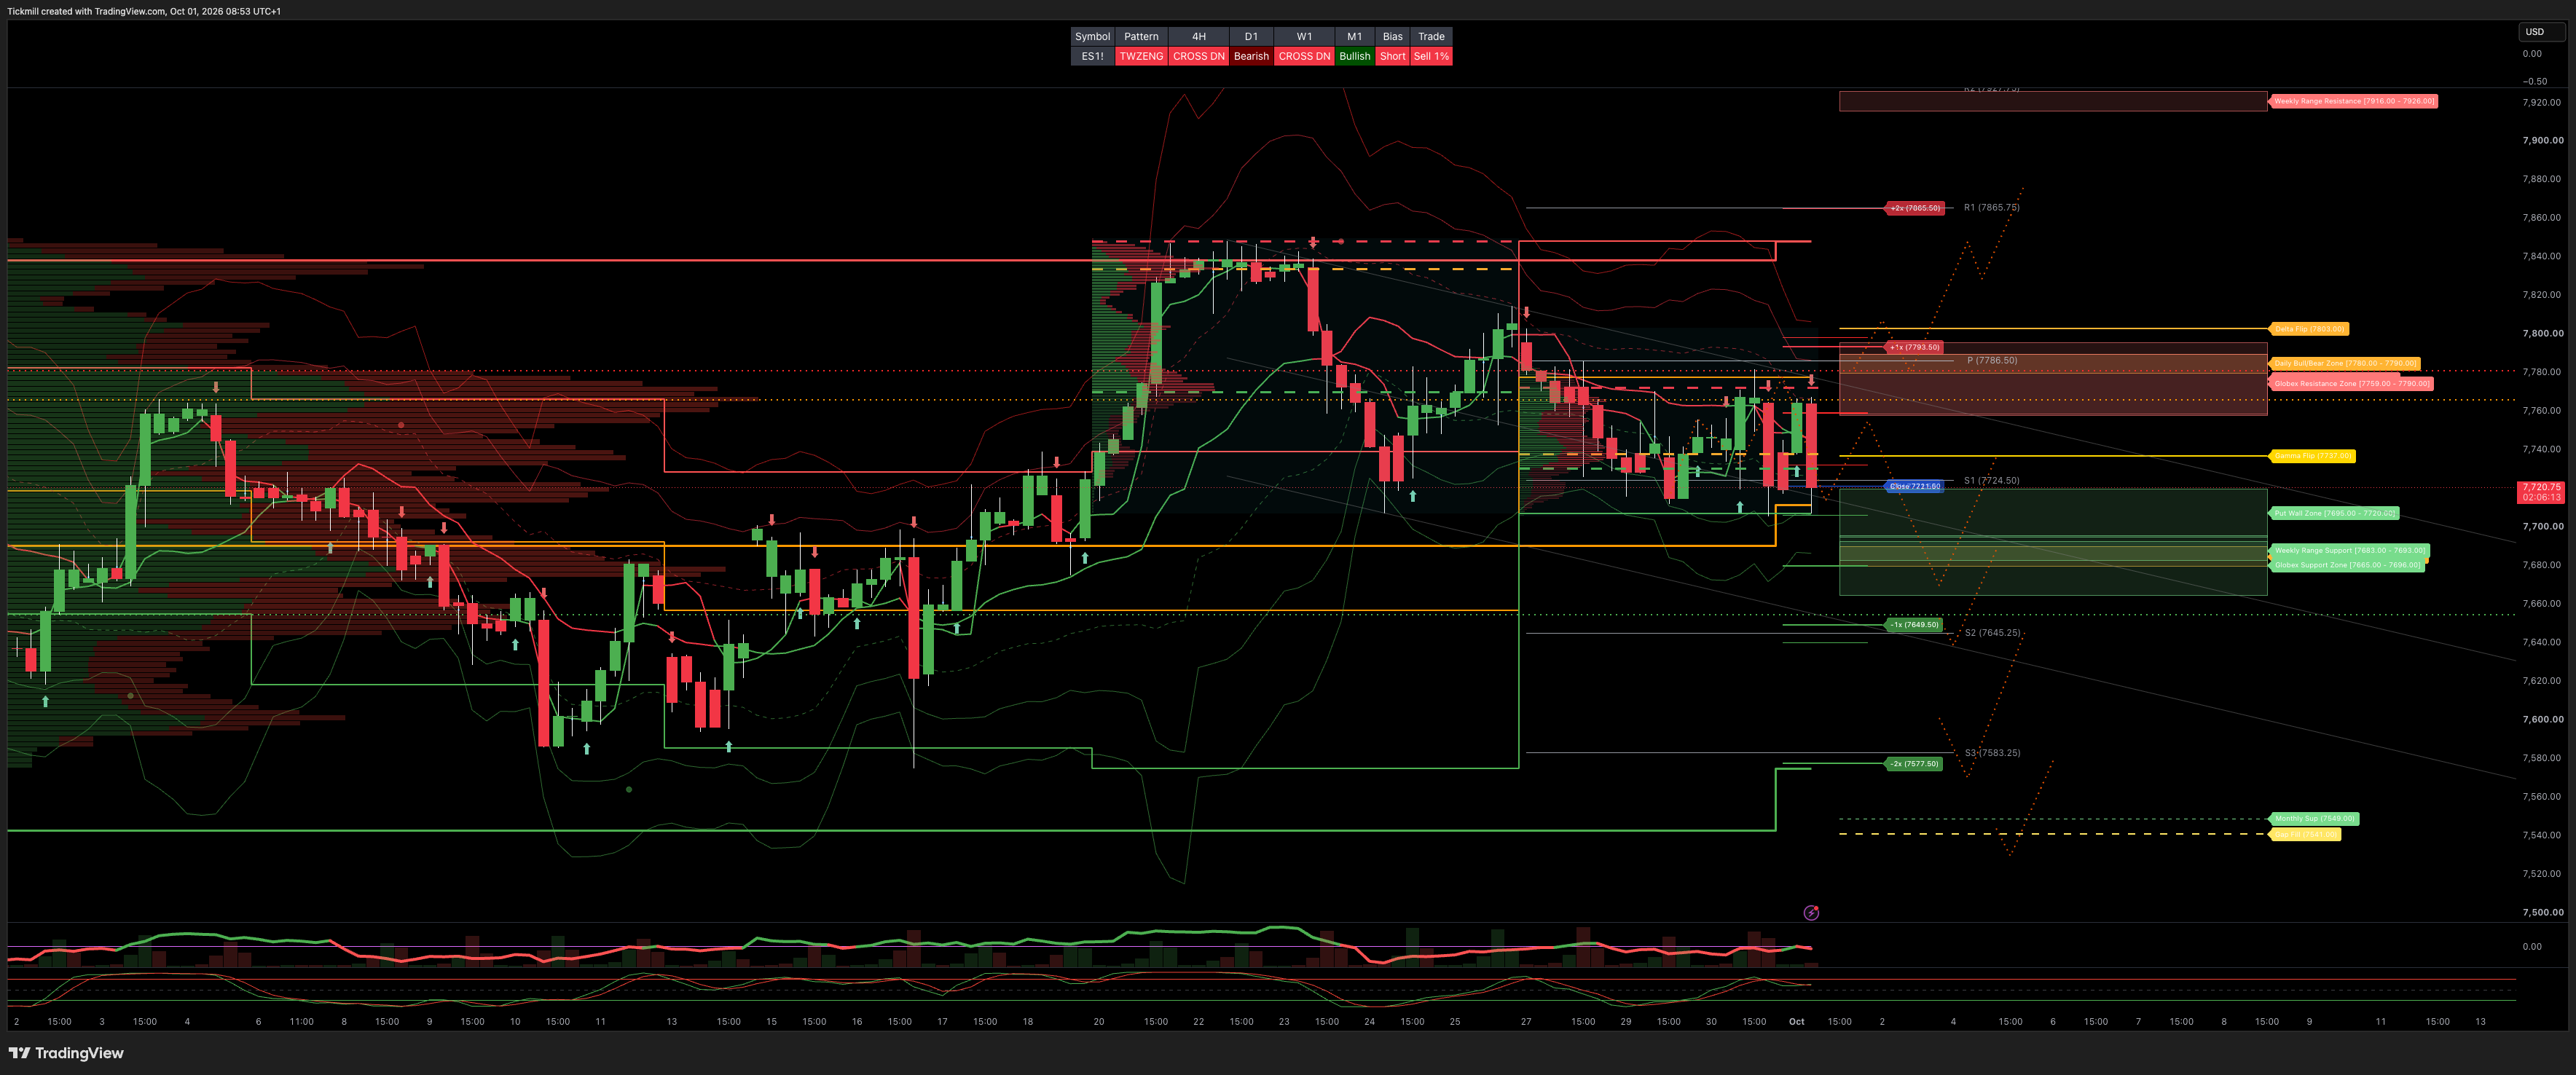
S&P500 Daily Action Areas & Price Targets 1/10/26
***QUOTING ES1!(Z CONTRACT LEVLES) FOR CASH US500 EQUIVALENT LEVELS, SUBTRACT POINT DIFFERENCE***
MONTHLY-WEEKLY& DAILY LEVELS
MONTHLY BULL BEAR ZONE 7440/7400
MONTHLY RANGE RES 7976 SUP 7549
WEEKLY BULL BEAR ZONE 7690/80
WEEKLY RANGE RES 7926/16 SUP 7683/93
DAILY BULL BEAR ZONE 7780/90
GLOBEX RANGE RES 7759/90 SUP 7696/65
GAMMA FLIP 7737
DELTA FLIP 7803
CALL WALLS 7758/7796
PUT WALLS 7695/7720
UNFILLED GAPS 7541
DAILY STRUCTURE - BALANCE 7786 - 7709
WEEKLY STRUCTURE - BALANCE 7848 - 7575
MONTHLY STRUCTURE - OTFH - 7542
VIX BULL BEAR ZONE 17.7
A VVIX/VIX ratio of ~5.40 is in the historical sweet spot, indicating stable options pricing with no immediate signs of panic or severe volatility-market stress.
PRIMARY TRADES & TARGETS
SHORT ON REJECT/RECLAIM DBBZ TARGET DAILY RANGE SUP
LONG ON ACCEPTNCE ABOVE THE DBBZ TARGET DAILY RANGE RES > ATH’S
***ADDITIONAL SETUPS & TARGETS HIGHLIGHTED ON THE CHARTS***
(I FADE TESTS OF 2 SIGMA LEVELS ESPECIALLY INTO THE FINAL HOUR OF THE NY CASH SESSION AS 90% OF THE TIME WHEN TESTED THE MARKET WILL CLOSE ABOVE OR BELOW THESE LEVELS)
SPX PUT/CALL RATIO 1.08 (The numbers reflect options traded during the current session.) A put-call ratio below 0.7 is generally considered bullish, and a put-call ratio above 1.0 is generally considered bearish.
JHEQX Upside cap (~7,920–7,950): Dealer gamma hedging at this call strike creates resistance, with market makers likely selling futures into strength and limiting volatility. Downside cushion (~7,270): If SPX drops 5% into Q4, long put gamma may force dealers to buy futures as the index falls, helping stabilize prices. Expiration: December 31, 2026. Strong pinning effects are likely near key strikes into year-end expiration.
DEC2025 OPEX to DEC2026 OPEX is 945 points giving us a range of [5889,7779]
Notes On Structure Implications
Balance: This refers to a market condition where prices move within a defined range, reflecting uncertainty as participants await further market-generated information. Our approach to balance includes favouring fade trades at the range extremes (highs/lows) while preparing for potential breakout scenarios if the balance shifts.
One-Time Framing Higher (OTFH): This represents a market trend where each successive bar forms a higher low, signalling a strong and consistent upward movement.
One-Time Framing Lower (OTFL): This describes a market trend where each successive bar forms a lower high, indicating a pronounced and steady downward movement.
GOLDMAN SACHS FICC & EQUITY TRADING DESK VIEWS
EQUITY & VOL DESK BRIEFING: US EQUITIES COLOR CHOPPY (Q3 CLOSE)
Author: Ariana Contessa (Goldman Sachs Vice President, FICC & Equities)
Date: September 30, 2026
THE TAKE: QUARTER-END PENSION SELL imbalance & FED TIMING SHIFT
US equities closed out Q3 on a choppy, mixed note. S&P 500 slipped -25 bps to 7,652, weighed down by a massive $11.5B Market-On-Close (MOC) sell imbalance (driven by month/quarter-end pension rebalancing modeled at $30.5B in net equity supply, 89th percentile over 3 years). The Nasdaq-100 bucked the trend, gaining +23 bps to 30,408.
Treasury yields continued their upward march (US 10-Year yield +5 bps to 5.29%), as markets looked through softer-than-expected August Core PCE inflation (+0.25% MoM vs. +0.30% cons). Coupled with recent hawkish framing from NY Fed President John Williams, Goldman Sachs Economics pushed back its next expected Fed rate hike from October to December. WTI Crude bounced +1.32% to $90.54/bbl, while Gold slipped -0.70% to $4,152/oz.
MARKET SUMMARY & ASSET BREAKDOWN
S&P 500 (SPX): Closed at 7,652.00 (-0.25%) | MOC $11.5B to SELL | VIX up +3.55% to 16.55 | Remaining weekly straddle: 91 bps
Nasdaq-100 (NDX): Closed at 30,408.00 (+0.23%) | Supported by Software outperformance and late Tech re-risking
Russell 2000 (RUT): Closed at 2,807.00 (-0.03%) | Held essentially flat despite 5.29% 10-Year yields
Dow Jones (DJI): Closed at 50,908.00 (-0.86%) | Dragged down by rate-sensitive industrial and value heavyweights
US 10-Year Treasury: Yield at 5.29% (+5.0 bps) | Pushing fresh 19-year cycle highs into Q4
WTI Crude: Price at $90.54 (+1.32%) | Rebounded back above $90/bbl on Middle East supply watch
Gold: Price at $4,152.00 (-0.70%) | Dragged lower by real rate pressure and USD firmness (DXY 101.50)
Bitcoin: Price at $83,501.00 (-0.09%) | Flat close into quarter-end
CBOE VIX: Closed at 16.55 (+3.55%) | Volatility surface held firm; non-profitable tech shorts squeezed
AFTER-HOURS HEADLINES & TECH EARNINGS
Micron Technology (MU +1% AH): Delivered solid FQ4 top-line beat ($54.0B vs. $51.5B cons) and gross margin beat (87.0% vs. 86.2% cons). FQ1 revenue guidance came in well above consensus ($60B–$63B vs. $57B cons), with mild sequential gross margin pushback (guided to 86.7% vs. 87.0% actual).
Alphabet (GOOG +2% AH): Surged after hours following the official release of its Gemini 4 "Argon" frontier AI model.
Intraday Sector Rotations: Distinct Software > Semis tilt across the floor. Jabil (JBL -10%) weighed on tech hardware sentiment ahead of MU, while FactSet (FDS +4%) rallied post-print. Short interest and non-profitable tech pockets experienced short-squeeze outperformance.
INSTITUTIONAL FLOWS & DERIVATIVES COLOR
Desk Activity (+600 bps Net Buy / 4/10 Rating):
Asset Managers (LOs): Finished as net buyers (+$600M net buy, concentrated in Tech and macro products).
Hedge Funds: Finished roughly flat (demand in Healthcare vs. supply in Tech and Industrials).
Derivatives & Volatility Dynamics:
Yield Reversion Trades: Active institutional buying in rate-sensitive upside options, highlighted by 50k 30Oct Utilities (XLU) 41 Calls and upside TLT calls.
2–3 Month QQQ Upside vs. SPY: Desk favors 2-3m QQQ upside call structures over SPY as the preferred vehicle to capture Q4 tech earnings and election dynamics.
Year-End Protection: Inflows into Q4 downside hedges accelerated into the close, including a large GS client purchase of 75k SPY 31Dec 650/550 Put Spreads.
Disclaimer: The material provided is for information purposes only and should not be considered as investment advice. The views, information, or opinions expressed in the text belong solely to the author, and not to the author’s employer, organization, committee or other group or individual or company.
Past performance is not indicative of future results.
High Risk Warning: CFDs are complex instruments and come with a high risk of losing money rapidly due to leverage. 69% and 73% of retail investor accounts lose money when trading CFDs with Tickmill UK Ltd and Tickmill Europe Ltd respectively. You should consider whether you understand how CFDs work and whether you can afford to take the high risk of losing your money.
Futures and Options: Trading futures and options on margin carries a high degree of risk and may result in losses exceeding your initial investment. These products are not suitable for all investors. Ensure you fully understand the risks and take appropriate care to manage your risk.
Patrick has been involved in the financial markets for well over a decade as a self-educated professional trader and money manager. Flitting between the roles of market commentator, analyst and mentor, Patrick has improved the technical skills and psychological stance of literally hundreds of traders – coaching them to become savvy market operators!