S&P500 Daily Action Areas & Price Targets 8/7/26

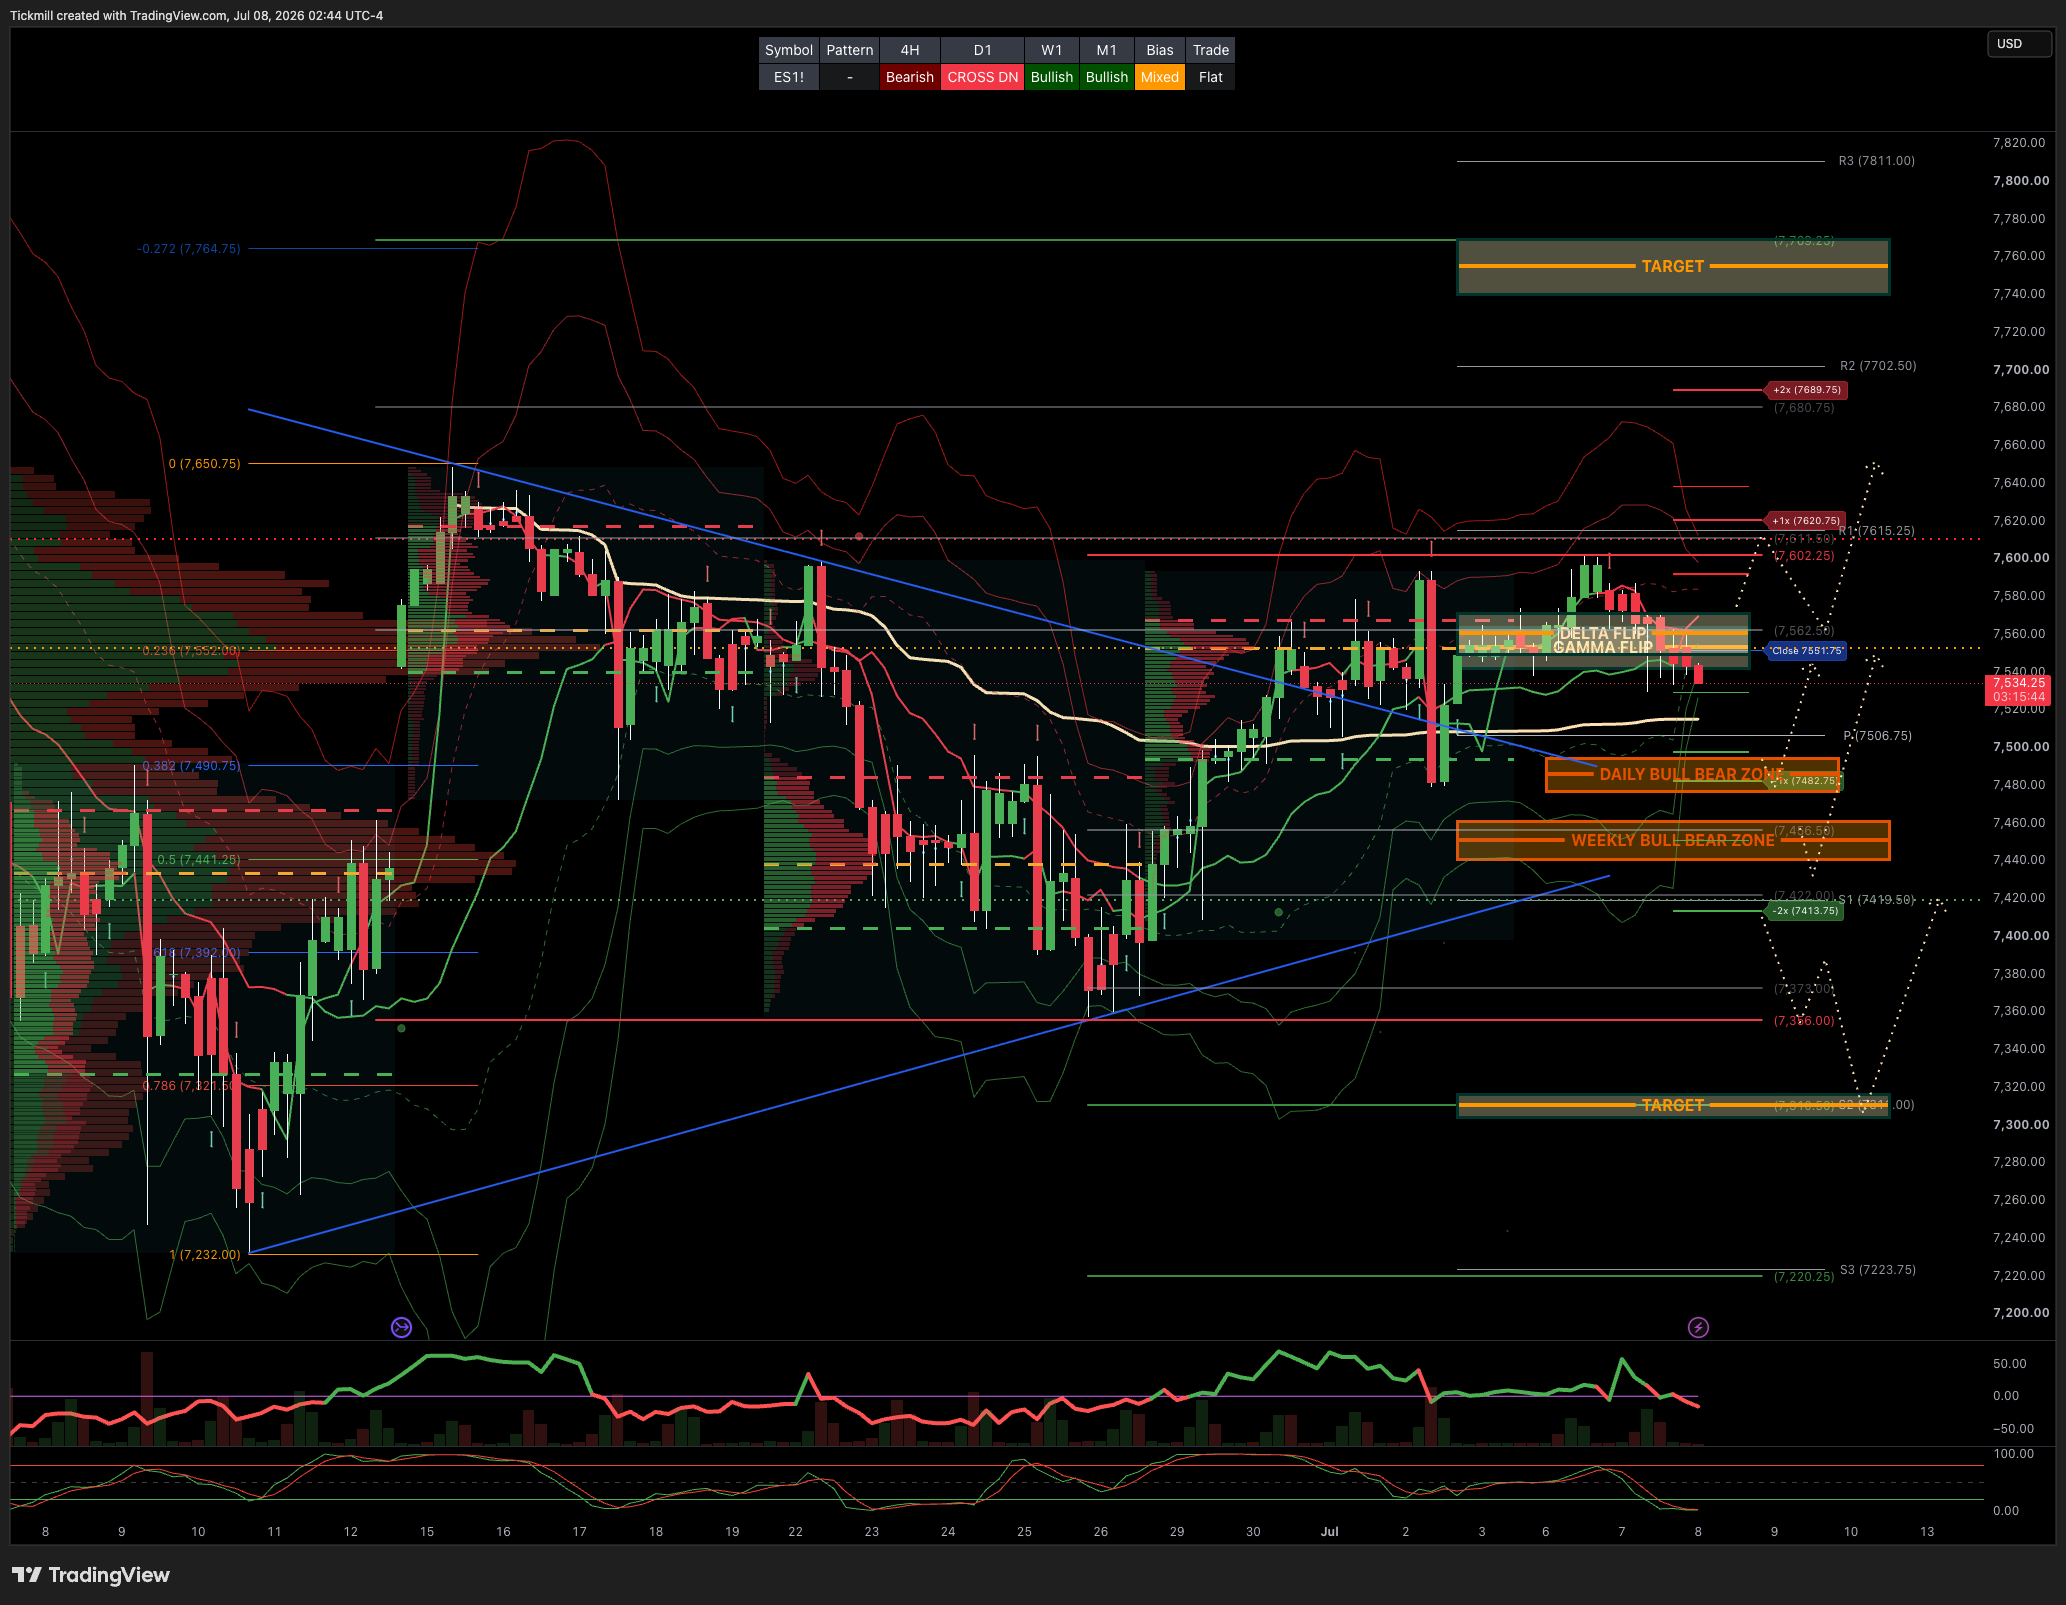
S&P500 Daily Action Areas & Price Targets 8/7/26
***QUOTING ES1! FOR CASH US500 EQUIVALENT LEVELS, SUBTRACT POINT DIFFERENCE***
WEEKLY BULL BEAR ZONE 7460/40
WEEKLY RANGE RES 7628 SUP 7428
MONTHLY RANGE RES 7932 SUP 7384
JHEQX Q3 Collar Short Call Cap: ~7,750 – 7,900 - Long Put Strike: ~7,050 – 7,100 (approx. 5% downside protection) Short Put Strike: ~5,950
DEC2025 OPEX to DEC2026 OPEX is 945 points giving us a range of [5889,7779]
SPX PUT/CALL RATIO 1.24 (The numbers reflect options traded during the current session.) A put-call ratio below 0.7 is generally considered bullish, and a put-call ratio above 1.0 is generally considered bearish.
GS Flow Desk: large S&P 31Aug 7000/7950 strangle in roughly $20mm vega / $115mm premium …My Read – classic “big convexity versus carry” trade: either someone paid a lot to own a wide August move, or someone got paid a lot to bet that the S&P stays comfortably inside the 7000–7950 corridor
DAILY VWAP BULLISH 7550
WEEKLY VWAP BULLISH 7476
MONTHLY VWAP BULLISH 7036
DAILY STRUCTURE - BALANCE 7602/7479
WEEKLY STRUCTURE - BALANCE 7648/7247
MONTHLY STRUCTURE - OTFH - 7199
Balance: This refers to a market condition where prices move within a defined range, reflecting uncertainty as participants await further market-generated information. Our approach to balance includes favouring fade trades at the range extremes (highs/lows) while preparing for potential breakout scenarios if the balance shifts.
One-Time Framing Higher (OTFH): This represents a market trend where each successive bar forms a higher low, signalling a strong and consistent upward movement.
One-Time Framing Lower (OTFL): This describes a market trend where each successive bar forms a lower high, indicating a pronounced and steady downward movement.
DAILY BULL BEAR ZONE 7495/85
GAMMA FLIP 7552
DELTA FLIP 7536
DAILY RANGE RES 7620 SUP 7482
2 SIGMA RES 7689 SUP 7413
VIX BULL BEAR ZONE 17.4
TRADES & TARGETS
LONG ON REJECT/RECLAIM DAILY BULL BEAR ZONE TARGET CLOSE > DAILY RANGE RES
***ADDITIONAL SETUPS & TARGETS HIGHLIGHTED ON THE CHARTS***
(I FADE TESTS OF 2 SIGMA LEVELS ESPECIALLY INTO THE FINAL HOUR OF THE NY CASH SESSION AS 90% OF THE TIME WHEN TESTED THE MARKET WILL CLOSE ABOVE OR BELOW THESE LEVELS)
GOLDMAN SACHS FICC & EQUITIES TRADING DESK VIEWS
US equities had an ugly session, but the index-level weakness again masked a healthier breadth picture beneath the surface. The S&P 500 fell 45bps to 7,503, the NDX dropped 177bps to 29,173, the Russell 2000 lost 90bps to 2,982, and the Dow slipped 25bps to 52,925. Volumes remained below normal at 17.583bn shares versus a YTD daily average of 19.691bn, while the close saw a $4bn MOC to buy. Cross-asset moves were less supportive than in prior sessions: VIX rose 360bps to 16.13, WTI jumped 502bps to $71.98, the 10-year yield rose to 4.5471%, gold fell 133bps to 4,110, DXY gained 21bps to 101.07, and Bitcoin was little changed at $63,708.
The main pressure point was renewed weakness in the global AI complex. Samsung fell around 9% in Korea despite strong preliminary results, including record operating profit, as investors took profits amid a slight revenue miss and elevated expectations. That weakness spilled into US semis and AI infrastructure, while Reuters headlines that DeepSeek is developing its own AI chips added another layer of concern around supply chains, competition, and long-term AI profit pools. The reaction reinforces the market’s current intolerance for anything less than perfect news from crowded AI winners.
High beta momentum fell another 6%, taking the drawdown to more than 20% over five days, with little evidence of meaningful defense in tech. The fundamental view among tech specialists reportedly remains positive, but buying has become much more selective after the feverish pace of demand in May and the first half of June. That distinction matters: the AI thesis has not necessarily broken, but the market is no longer rewarding the whole complex indiscriminately. Investors are increasingly differentiating between companies with durable earnings power, credible capex visibility, and pricing leverage versus those that simply benefited from the first-half momentum wave.
ETF and leveraged ETF activity likely amplified the move. SOXL volumes were tracking 35% above the 30-day average and the product is now down roughly 50% from its all-time highs made just 10 sessions ago. DRAM volumes were 60% above average, and SMH volumes were 30% above average. That type of turnover suggests that the unwind is not just fundamental stock-picking; it is also mechanical de-risking through high-beta vehicles, levered products, and crowded thematic ETFs. In a thin summer market, that can magnify downside in semis and AI infrastructure even when broader index breadth remains resilient.
Breadth was the most constructive part of the session, with 283 S&P 500 names closing green despite the S&P finishing lower and the NDX underperforming sharply. That is a clear sign of continued broadening. The market is not seeing a uniform risk-off liquidation; it is seeing a large-cap AI / momentum unwind alongside relative strength in other parts of the index. This supports the thesis that the index can remain more durable than the most crowded leadership groups, even if headline tech weakness creates a more volatile tape.
Flows were mixed but tilted toward supply. The floor was a 5 out of 10 in terms of activity and finished 210bps for sale versus a 30-day average of 74bps to buy. Asset managers were roughly flat, with small supply in discretionary and healthcare offset by demand in macro products. Hedge funds were around $1bn net sellers, driven by supply in supercap tech, partly offset by smaller healthcare demand. This fits the broader pattern: investors are not abandoning equities altogether, but they are reducing exposure to the crowded tech leadership complex and seeking protection or diversification elsewhere.
The derivatives tape also points to a market moving into a more differentiated regime. Activity picked up after the holiday slowdown, with continued de-risking in high beta momentum. SPXXAI is reportedly proving to be a decent hedge, which is notable given the concentration of pain in AI-related exposures. Index options flow was muted overall, though there were some S&P skew buyers, suggesting selective demand for downside protection rather than broad panic. Tomorrow’s straddle went out at 48bps, indicating the market is not pricing an extreme near-term index move despite the violence under the surface.
The most important volatility signal is that S&P 1-month implied correlation is sitting at the lowest level seen in the last 20 years. That is an extraordinary statement about market structure. The vol market is effectively forecasting a period of differentiation, where index volatility may remain contained while single-name and sector dispersion rises. In practice, that means winners and losers will be separated by their ability to exceed already elevated expectations. This is consistent with earnings season risk: companies tied to crowded AI themes need to deliver not just strong results, but strong results versus very high expectations
The rise in WTI and yields added some pressure to the tape. Oil’s 5% jump back toward $72 complicates the recent macro relief narrative, especially after energy had been one of the supportive inputs for equities. The move in the 10-year yield to 4.55% also matters because lower rate pressure had helped the recent rotation into software, megacap platforms, housing, and other duration-sensitive areas. If oil and yields both move higher at the same time, the market’s ability to broaden could be tested, even if the immediate damage remains concentrated in AI and momentum.
Given the S&P closed at 7,503 and tomorrow’s straddle went out at 48bps, the options market is implying roughly a ±36 point move for the next session. That puts the implied one-day range at approximately 7,467 to 7,539. In percentage terms, the market is pricing a relatively contained index move despite the significant under-the-surface volatility in AI, semis, and high-beta momentum.
Disclaimer: The material provided is for information purposes only and should not be considered as investment advice. The views, information, or opinions expressed in the text belong solely to the author, and not to the author’s employer, organization, committee or other group or individual or company.
Past performance is not indicative of future results.
High Risk Warning: CFDs are complex instruments and come with a high risk of losing money rapidly due to leverage. 69% and 73% of retail investor accounts lose money when trading CFDs with Tickmill UK Ltd and Tickmill Europe Ltd respectively. You should consider whether you understand how CFDs work and whether you can afford to take the high risk of losing your money.
Futures and Options: Trading futures and options on margin carries a high degree of risk and may result in losses exceeding your initial investment. These products are not suitable for all investors. Ensure you fully understand the risks and take appropriate care to manage your risk.
Patrick has been involved in the financial markets for well over a decade as a self-educated professional trader and money manager. Flitting between the roles of market commentator, analyst and mentor, Patrick has improved the technical skills and psychological stance of literally hundreds of traders – coaching them to become savvy market operators!