S&P500 Trading Update 22/4/26

S&P500 Trading Update 22/4/26
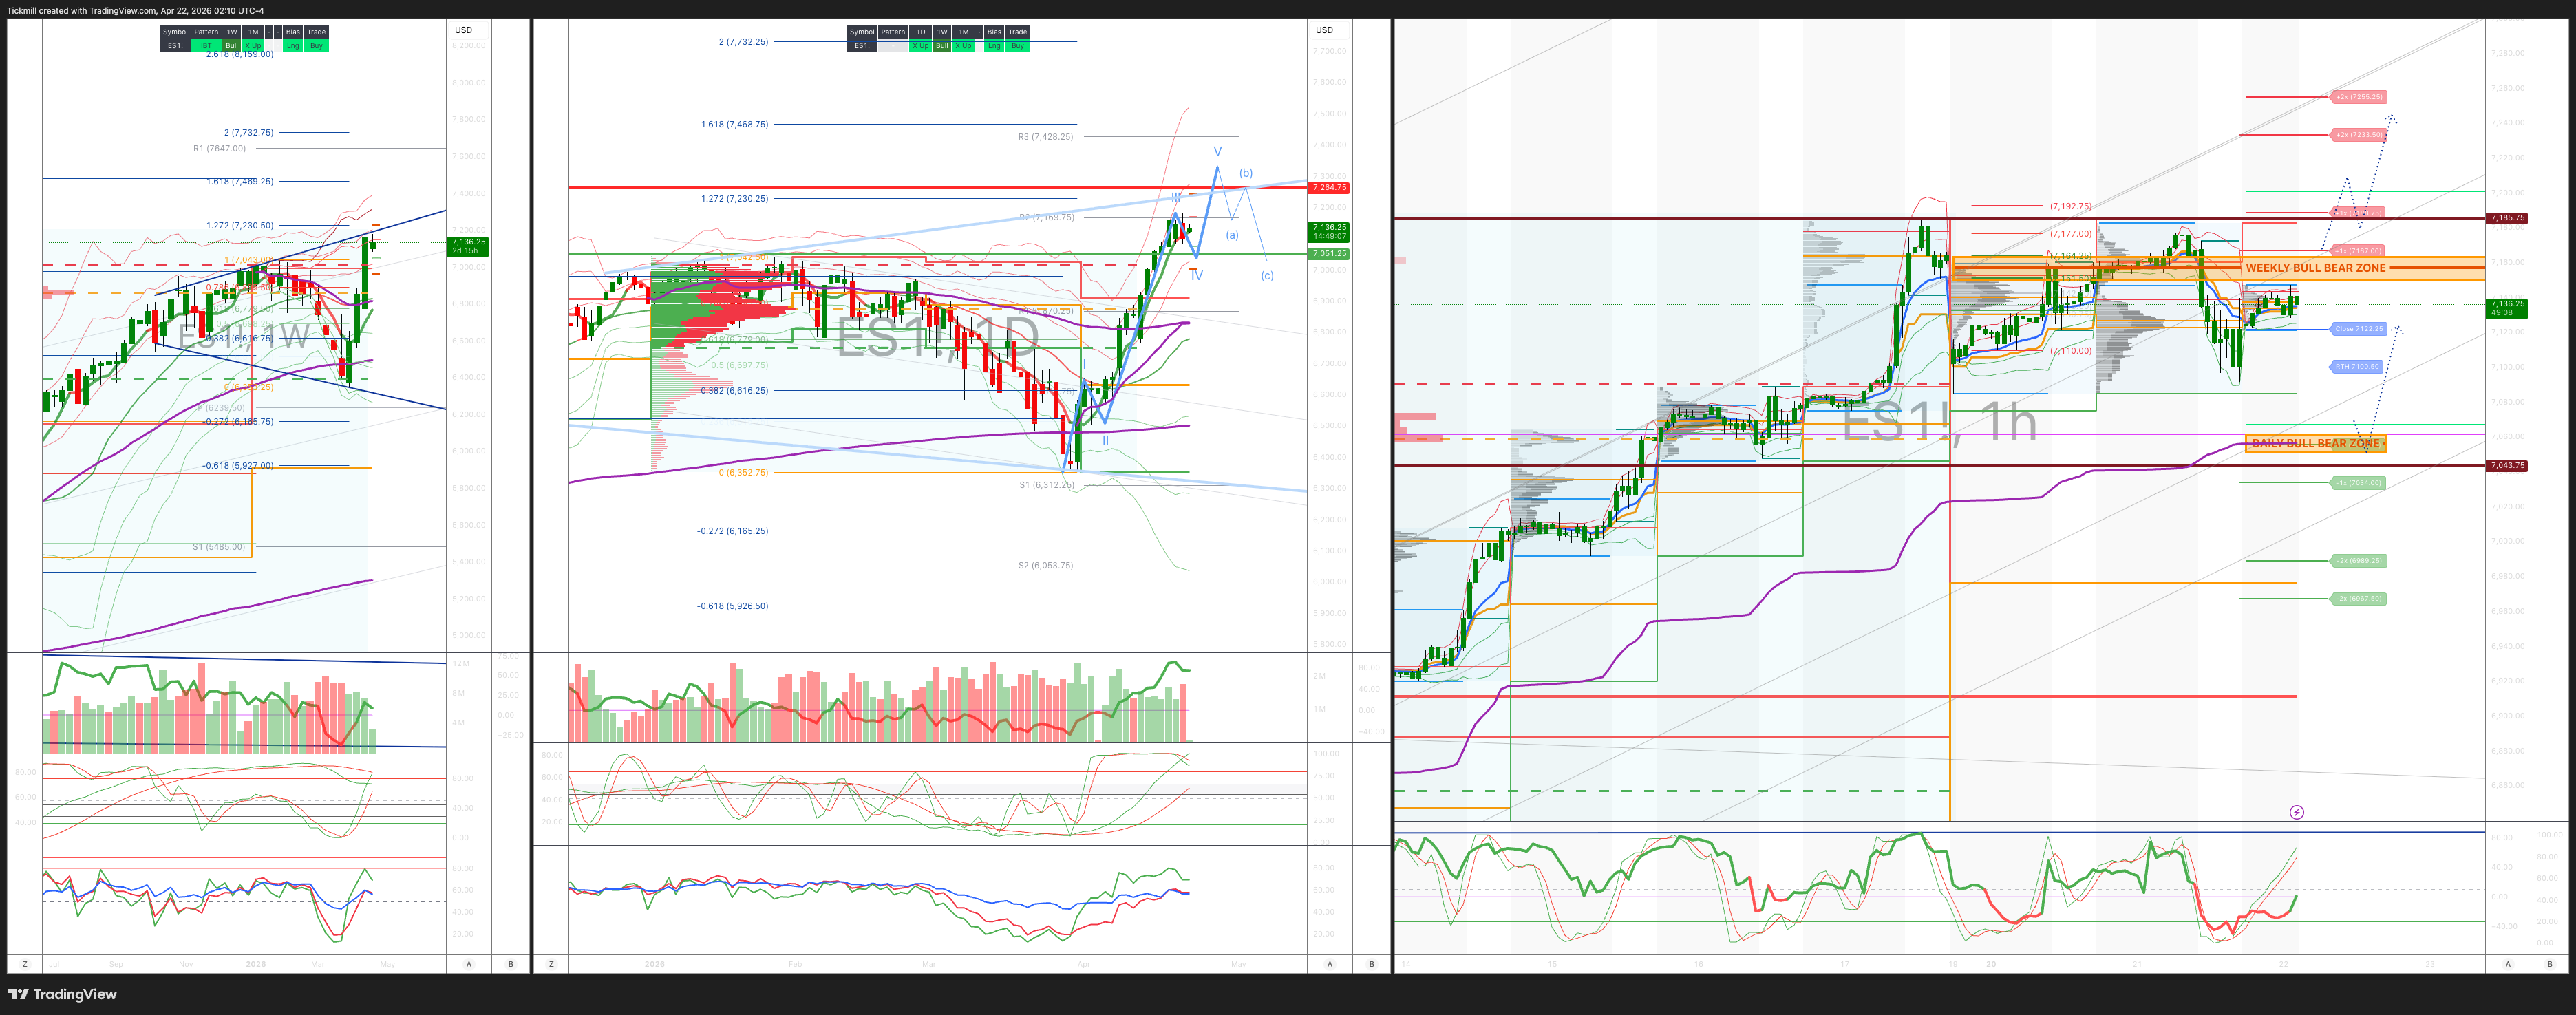
***QUOTING ES1! FOR CASH US500 EQUIVALENT LEVELS, SUBTRACT POINT DIFFERENCE***
WEEKLY BULL BEAR ZONE 67150/60
WEEKLY RANGE RES 7262 SUP 7050
May OPEX Straddle: 225pt range implies a OPEX to OPEX range of [6900, 7350]
June QOPEX Straddle is 546.4pt giving us a range of [5960,7052]
JHEQX Q2 Collar 6189/6290 - 6865/6955
DEC2025 OPEX to DEC2026 OPEX is 945 points giving us a range of [5889,7779]
SPX PUT/CALL RATIO 1.22 (The numbers reflect options traded during the current session. A put-call ratio below 0.7 is generally considered bullish, and a put-call ratio above 1.0 is generally considered bearish)
DAILY VWAP BULLISH 7122
WEEKLY VWAP BULLISH 6825
MONTHLY VWAP BULLISH 6815
DAILY STRUCTURE – BALANCE - 7185/7085
WEEKLY STRUCTURE – OTFH - 6826
MONTHLY STRUCTURE - OTFD - BALANCE
Balance: This refers to a market condition where prices move within a defined range, reflecting uncertainty as participants await further market-generated information. Our approach to balance includes favouring fade trades at the range extremes (highs/lows) while preparing for potential breakout scenarios if the balance shifts.
One-Time Framing Higher (OTFH): This represents a market trend where each successive bar forms a higher low, signalling a strong and consistent upward movement.
One-Time Framing Down (OTFD): This describes a market trend where each successive bar forms a lower high, indicating a pronounced and steady downward movement.
DAILY BULL BEAR ZONE 7060/50
DELTA FLIP 6831
DAILY RANGE RES 7214 SUP 7081
2 SIGMA RES 7291 SUP 7015
VIX BULL BEAR ZONE 19.5
TRADES & TARGETS
LONG ON REJECT/RECLAIM OF DAILY BULL BEAR ZONE TARGET RTH/ETH CLOSES > DAILY RANGE RES
***ADDITIONAL SETUPS & TARGETS HIGHLIGHTED ON THE CHARTS***
(I FADE TESTS OF 2 SIGMA LEVELS ESPECIALLY INTO THE FINAL HOUR OF THE NY CASH SESSION AS 90% OF THE TIME WHEN TESTED THE MARKET WILL CLOSE ABOVE OR BELOW THESE LEVELS)
GOLDMAN SACHS TRADING DESK VIEW - ‘Unease’
US equities finished modestly lower on Tuesday, giving back early gains as investors worked through another round of Iran-related headlines and a stronger-than-expected US retail sales print. The S&P 500 fell 0.63% to 7,064, the Nasdaq 100 lost 0.42% to 26,479, the Russell 2000 underperformed, down 1.00% to 2,765, and the Dow declined 0.59% to 49,149. Into the close, there was a $3.2bn MOC buy imbalance, while total tape came in relatively light at 18.2bn shares, below the 19.4bn YTD daily average.
Cross-asset price action reflected a more cautious tone. VIX rose 3.34% to 19.5, WTI crude jumped 2.81% to $92.13, and the US 10-year yield climbed 5bp to 4.30%. Elsewhere, gold fell 2.38% to 4,706, the DXY rose 0.24% to 98.32, and Bitcoin slipped 0.71% to $75,780.
The main macro driver was a combination of geopolitical uncertainty and resilient US data. Markets spent the session reacting to reports that Vice President Vance had cancelled a planned trip to Pakistan for a second round of talks with Tehran, alongside news that Washington imposed a fresh round of sanctions on Iran and boarded an Iran-linked ship in the Indo-Pacific. Sentiment later stabilized somewhat after headlines that Trump had extended the Iran ceasefire until talks conclude, but the broader message for markets was that geopolitical risk remains very much alive.
On the data side, US retail sales exceeded expectations, rising 0.7% compared to the consensus of 0.2%, with broad-based gains across categories. In response, Goldman’s GIR team lifted its Q1 GDP tracking estimate by 0.5pp to 3.3% qoq saar, reinforcing the idea that US growth remains firm even as markets continue to debate the medium-term path for rates.
Under the surface, software remained a key focus. There was a strong sense that anxiety levels in the space have picked up, with IGV now up seven consecutive sessions and 19% over that stretch. What initially looked like a bounce easy to dismiss is increasingly starting to pressure shorts and underweights, even though conviction in the broader AI disintermediation bear case remains elevated.
Flow data pointed to a fairly muted session overall. Desk colour suggested activity was roughly a 4 out of 10, though the firm’s floor finished +380bp to buy versus a 30-day average of +6bp. Asset managers were modest net sellers, with supply spread across most sectors outside financials. Hedge funds, primarily driven by demand in energy and healthcare, emerged as small net buyers, while tech and staples saw concentrated selling.
In derivatives, the tone turned more defensive. The market broke out of the recent “spot-up/vol-up” pattern seen during the rally to all-time highs as geopolitical concerns reasserted themselves. Clients were active early in the session, with flows skewed toward adding short-dated hedges. There was also demand for Mag-7 volatility in earnings, reflecting the view that risks are asymmetrically tilted to the upside. Skew was bid across the curve, especially in the front end, while dealers remain slightly long gamma at current levels. Broader sentiment has improved materially from the March lows, with the Risk Appetite Indicator rising to the 94th percentile on a four-year lookback and the Vol Panic Index at 5.75/10. The implied move for the remainder of this earnings-heavy week widened to around 1.38%.
Post-close, Capital One fell 5% despite better expense performance, beating on costs by $380mn, including roughly $200mn in marketing. However, the company missed on revenue by around $160mn, largely due to softer NII, while NIM was also slightly light. Provisions were a modest miss, though card trends appeared broadly in line, with weakness seemingly more concentrated in commercial.
A modestly weaker close on the surface, but the bigger takeaway was a market caught between resilient macro data, rising geopolitical friction, and a renewed bid for protection into earnings. Beneath the index moves, software squeeze dynamics, firmer oil, stronger retail sales and front-end hedging demand were the more important signals.
Disclaimer: The material provided is for information purposes only and should not be considered as investment advice. The views, information, or opinions expressed in the text belong solely to the author, and not to the author’s employer, organization, committee or other group or individual or company.
Past performance is not indicative of future results.
High Risk Warning: CFDs are complex instruments and come with a high risk of losing money rapidly due to leverage. 71% and 74% of retail investor accounts lose money when trading CFDs with Tickmill UK Ltd and Tickmill Europe Ltd respectively. You should consider whether you understand how CFDs work and whether you can afford to take the high risk of losing your money.
Futures and Options: Trading futures and options on margin carries a high degree of risk and may result in losses exceeding your initial investment. These products are not suitable for all investors. Ensure you fully understand the risks and take appropriate care to manage your risk.
Patrick has been involved in the financial markets for well over a decade as a self-educated professional trader and money manager. Flitting between the roles of market commentator, analyst and mentor, Patrick has improved the technical skills and psychological stance of literally hundreds of traders – coaching them to become savvy market operators!